Why We Need To Sell WTI Crude Oil
The WTI crude oil has maintained a bullish momentum throughout the Asian and the European trading sessions to trade nearly $51.75. Yesterday, as we discussed in our previous report, the strong bullish trend in the energy sector started after the release of the better than expected economic data. Specifically, the factory orders went up by 1.0% from last month along with the positive trade balance figures.

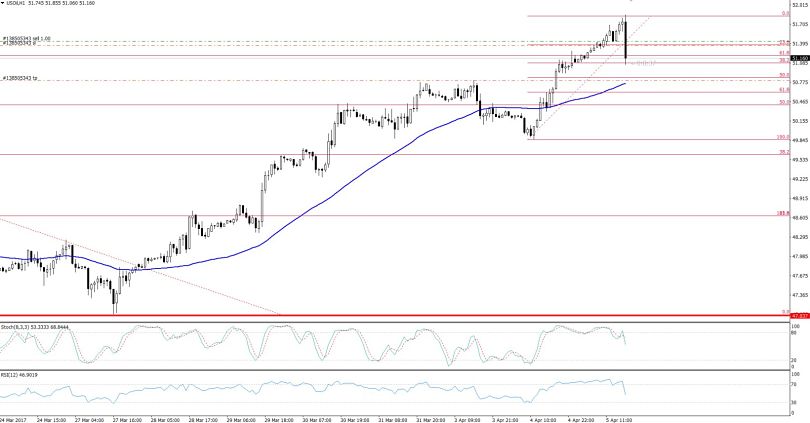
Crude Oil – Hourly Chart
Major Reasons Behind A Bearish Market
Looking at the 1-hour chart, we can see the RSI was holding above 70, demonstrating that buyers are exhausted and they may take profit here. Causing the oil to lower to complete the up to 38.2% ($51.08) and 50% ($50.85). Moreover, a spinning top candle in an overbought territory was extending additional support the selling sentiment.
Additionally, the EIA (Energy Information Administration) released the crude inventories figures, which revealed an increase of 1.57 million barrels for the month of February. Moreover, inventors attained new highs of 535.5 million barrels. Recalling the law of supply, investors are likely to sell the Crude Oil.
Forex Trading Signal: Fellows, I have just shared a WTI Crude Oil trading signal, recommending a sell at $51.41 with a stop loss around $51.80 and a take profit at $50.85. What you need to do is drag your stops at the break even point to avoid reversals.
- Check out our free forex signals
- Follow the top economic events on FX Leaders economic calendar
- Trade better, discover more Forex Trading Strategies
- Open a FREE Trading Account


