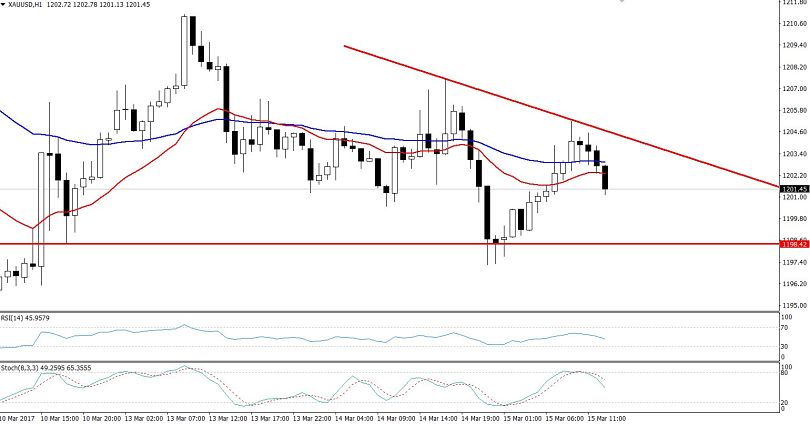
Ascending Triangle Pattern & Gold – Potential Trade Idea
Over the previous week, the Gold prices fell to an 8-week low near $1214. The drop in prices was anticipated and we had already advised having a buy position above $1214 in our earlier update, Green Pips In The Gold – A New Trade Setup Ahead.
Later, the Gold prices pulled back up from the $1214 level. The main reasons behind the bullish wave in Gold were the weaker dollar and drop in bond yield, which encouraged traders to invest in substitutes such as bullion.
Forex Trading Signal
At this point, the Gold is consolidating in the sideways set up and is likely to break in the New York session tomorrow. I will be looking to add a buy position at $1235 with a stop loss below $1232 and a take profit at $1241.
On the flip side, we can benefit from the choppy trading by selling below $1234 with a stop loss above $1236 and take profit at $1229.
 Gold Triangle Pattern – Hourly Chart
Technical Outlook – Intraday
On the 4-hour chart, we can see that the Gold has formed an ascending triangle pattern which is extending a strong resistance at $1234 and a support at $1227. As per the technical analysis, ascending triangle patterns are meant to break downward.
The price has crossed above 50 periods EMA along with the RSI, which is holding above 50 and signaling a bullish sentiment on the part of investors.


