Forex Signals Brief for May 16th – Time To Ride The Volatile Market
The 3rd week of May started with a bang as nearly all of our forex trading signals remained successful. The Nikkei, in particular, gave us two trading signals and both of these matured at take profit. The signal on WTI Crude Oil was also successful.
As discussed in our Forex Signals Brief 15th – 20th May, we are likely to have countless trade opportunities in the current week. This is because nearly all economies have several events happening this week that are important enough to cause price action in the market.
The U.S. dollar continued to trade under pressure due to the echoing effects of unfavorable inflation and retail sale figures released on Friday. Moreover, the weaker than expected U.S. manufacturing data also played its role in lightening demand for the greenback.
Major Economic Events To Watch Today
USD
- Building Permits (13:30)
- Housing Starts (13:30)
- Capacity Utilization Rate (14:15)
- Industrial Production m/m (14:15)
- Mortgage Delinquencies (15:00)
AUD
- Monetary Policy Meeting Minutes (2:30)
GBP
- CPI y/y (9:30)
- PPI Input m/m (9:30)
- RPI y/y (9:30)
EUR
- Flash GDP q/q (10:00)
- German ZEW Economic Sentiment (10:00)
NZD
- GDT Price Index (tentative)
- PPI Input q/q (23:45)
EUR/USD – Is It Time To Sell?
The Euro, as a single currency, edged higher due to a weaker U.S. dollar. As we know, the economic numbers released by the U.S. economy weren't as good as expected, specifically, the CPI and retail sales. The U.S. inflation came in at 0.2% versus the expected gain of 0.3% for the month of April.
The drop in U.S. inflation increases the odds that the Fed may reconsider their rate hike decision. This ultimately weakens the greenback and increases the demand for peer currencies.
We also can't ignore that the Euro is still a supported currency due to the French election results and Macron's victory.
Forex Trading Signal
Thankfully, our weekly forex trading signal recommended in Forex Signals Brief 15th – 20th May is likely to hit take profit level at $1.1000. Having said that, I would recommend traders wait for the market to close our earlier position. I may sell the EUR/USD below $1.1020 with a stop loss of $1.0450 and a take profit of $1.0965.

EURUSD Descending Trendline – Daily Chart
.jpg)
Technical Outlook- Intraday
Let me draw your attention to the daily chart. We can see a "Three White Soldiers" candlestick pattern which is about to form below a major descending trend line. Indeed, it's making the situation more complicated as the trend line suggests a bearish bias whereas the "Three White Soldiers" indicates a great buying sentiment for investors.
In my opinion, the best idea is to wait for the market to show us a clear signal. The breakage above $1.1030 is likely to lead the market towards $1.1130 and this can be a potential selling level in the upcoming days.
Support Resistance
1.0934 1.1001
1.0895 1.1029
1.0867 1.1068
GBP/USD – Traders Ready To Trade Bullish Flag
The sterling has finally made its move upward against the U.S dollar. It's not the strong pound, but rather the weaker dollar, which is dragging the currency pair upward.
In fact, GBP/USD remained under pressure after the BOE Monetary Policy Committee left the interest rate at 0.25%. On the other hand, the sterling exhibited major weakness due to a weaker inflation report by the Bank of England.
Today, the market is waiting for the CPI and PPI figures from the United Kindom as they are high impact economic events which may cause huge fluctuations in the market.
Forex Trading Signal
In my opinion, it's a good idea to have a buy position above $1.2900 with a stop loss of $1.2875 and a take profit of $1.2945.
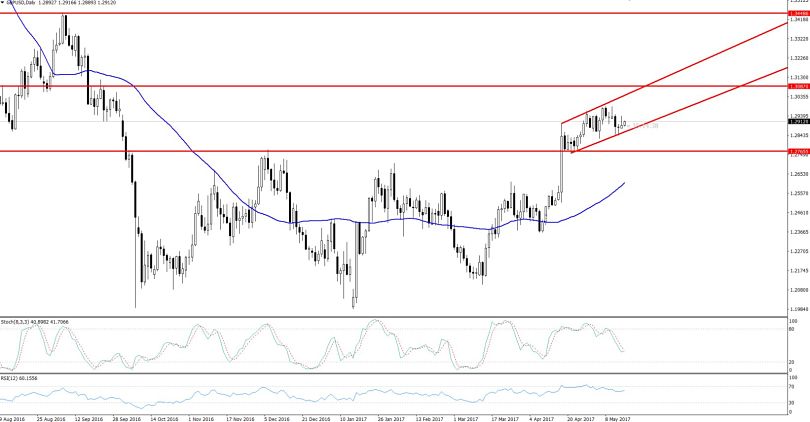
GBPUSD Bullish Flag – Daily Chart
Technical Outlook – Intraday
On the 4-hour chart, the GBP/USD has formed a bullish channel which is proving to be an intraday support to the sterling at $1.2880.
Zooming out of the daily chart clearly shows a bullish flag which is likely to break upward. Quite interestingly, the flag has formed above a triple top level of $1.2725 which is now working as a significant support level.
The momentum indicator RSI is still holding above 50, signaling a buying trend in the market.
Support Resistance
1.2867 1.293
1.284 1.2966
1.2804 1.2993
Ending Remarks
The market is likely to remain volatile today due to several economic events which are set to be released from the Unites States and the United Kingdom. All we need to do is wait for the news and identify the right trading level to enter the market. Keep following, as we may have several forex trading signals today!
- Check out our free forex signals
- Follow the top economic events on FX Leaders economic calendar
- Trade better, discover more Forex Trading Strategies
- Open a FREE Trading Account
- Read our latest reviews on: Avatrade, Exness, HFM and XM
Related Articles


Sidebar rates
Related Posts
