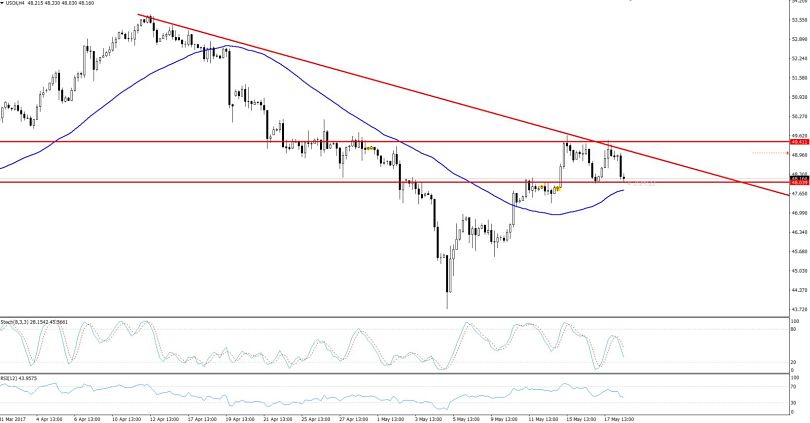
Trade The Range – WTI Crude Oil
In the European trading session, the crude oil prices slipped as the market was oversupplied with crude oil. Unlike other commodities, the crude oil isn't responding to the weaker U.S. dollar.
Investors are confused because, despite all the effort done by OPEC and Non-OPEC countries, they seem to be failing in curbing the oil output to support the falling oil prices.
As we wrote in our earlier update entitled Wrapping Up The Forex Trading Day – May 17th, the EIA released a report on crude oil inventories which indicated a draw of 1.75 million barrels for the week and a draw of 5.25 million barrels the previous week. As a result, the crude oil edged slightly higher, but the gains remained limited.
Forex Trading Signal
I recommend having a buy position above $48.10 with a stop loss below $47.90 and a take profit above $48.40.
 WTI Crude Oil – Sideways Trend In H4
Technical Outlook – Intraday
Taking a look at the hourly chart, the oil is stuck in the narrow trading range of $48 – $49.45. Technically, the black gold seems neutral, but it still has potential to offer exciting trade opportunities.
At the moment, the black gold is testing the lower band of the range near $48 and is likely to form a test bar candlestick pattern. This demonstrates seller's weaker sentiment which motivates the buyers to jump into the market.
Lastly, the momentum indicator is also recommending a reversal in the oversold crude oil. Now we have to monitor the Philly Fed Manufacturing Index from the U.S., which is likely to be released during the New York session. The economic figures from the world's biggest crude oil consumer have the potential to impact oil prices, especially when the economic indicator is about manufacturing sectors.
- Check out our free forex signals
- Follow the top economic events on FX Leaders economic calendar
- Trade better, discover more Forex Trading Strategies
- Open a FREE Trading Account


