Bearish Flag Pattern In WTI Crude Oil – Sellers Loom!
Yesterday, was a great day for our forex trading signals. Both our signals on WTI Crude hit take profit, one after the other The signals, discussed in our update A Quick Profit In The WTI Crude Oil – What’s Next?, were close call as the market reversed right after testing our take profit at $46.60.
Despite the recent gains in the oil prices, the energy market has been under pressure over the past few weeks. This is due to the rising output of US shale oil, which is offsetting the impact of OPEC as well as the Non- OPEC members.
In an OPEC deal, Saudi Arabia, the world's top oil exporter, agreed to cut production by almost 1.8 million barrels per day (bpd) until the 1st quarter of 2018. However, the efforts seem to have a muted impact on the oil prices.
Forex Trading Signal – Idea
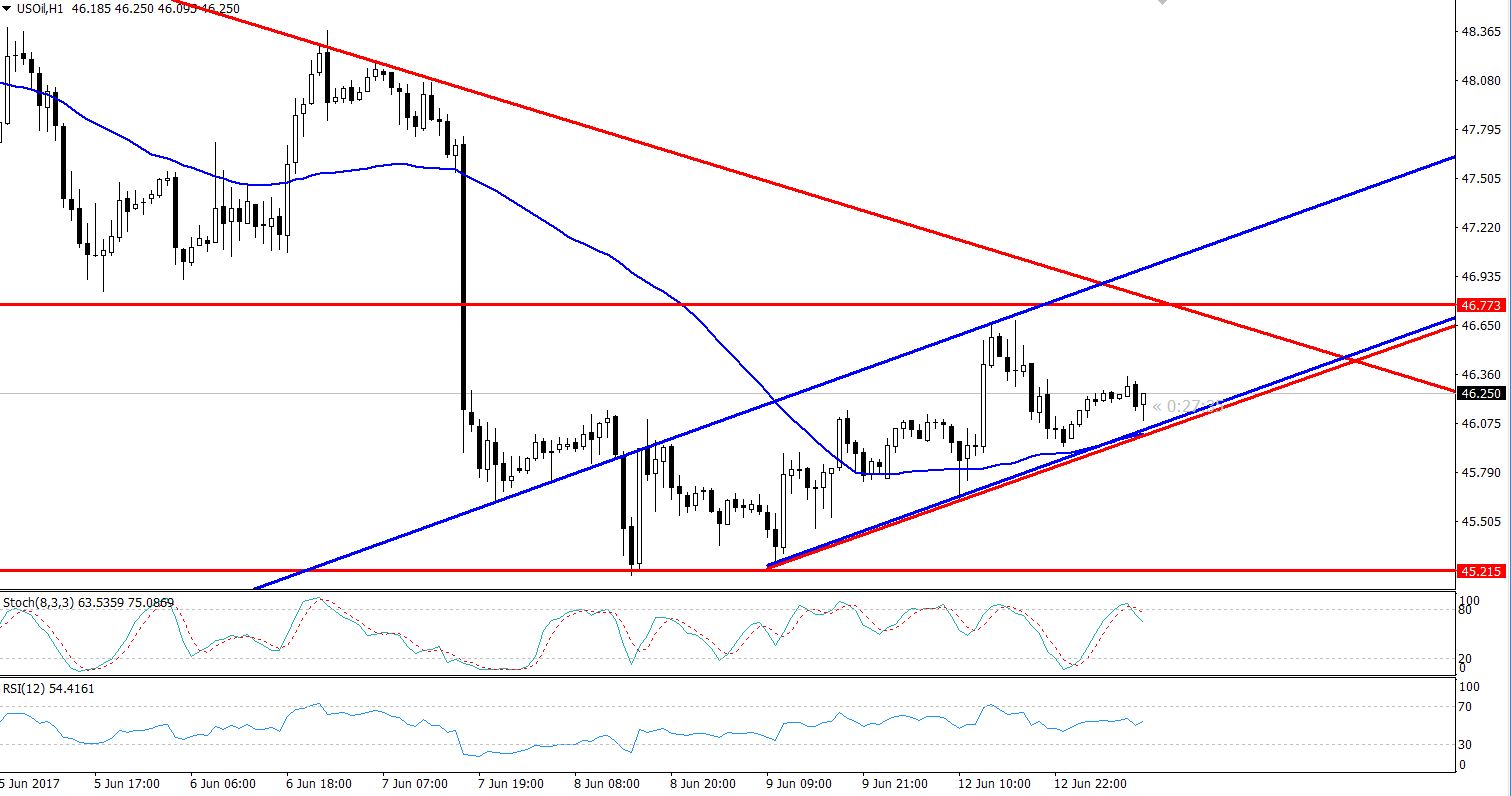
Today, in the absence of relevant economic events, we are left with trying to trade the choppy market. Having said that, we need to keep a close eye on the $45.95, as below this level, the market is likely to target $45.45.
On the other hand, I would like to stay in buying above $46, in order to target $46.60.
 Bearish Flag In Crude Oil – Hourly Chart
Technical Outlook- Intraday
On the hourly chart, the WTI Crude Oil has formed a bearish flag pattern which is extending ia strong support at $46 and a resistance somewhere around $46.75.
Moreover, the 50-periods EMA is also extending investors' bullish bias and is coincidentally also providing a support at $46. The RSI is totally neutral as investors await fresh fundamentals in order to decide further trends.
Tomorrow, the economic calendar is packed with high-impact economic events which are likely to influence the WTI crude oil. Therefore, there is a high probability of a breakout on Wednesday.
- Check out our free forex signals
- Follow the top economic events on FX Leaders economic calendar
- Trade better, discover more Forex Trading Strategies
- Open a FREE Trading Account


