Bullish Crude Oil Reached Resistance – Potential Trade Plan
After soaring dramatically last week, ending a 5-week losing streak, today the oil is not showing much movement. The reason why investors are increasing their bets on the crude oil is multifold.
Firstly, the WIT Crude Oil gained as Qatar faced demands by Gulf nations to halt alleged backing for terrorism. Qatar plays an important role the production of crude oil and the demands are causing uncertainties over the oil output. Though the oil output is still abundant in the market, the fear is ruling the prices.
Forex Trading Signal – Idea
Investors are recommended to have a sell position only below $46.10 with a stop loss of $46.35 and a take profit of $45.85.
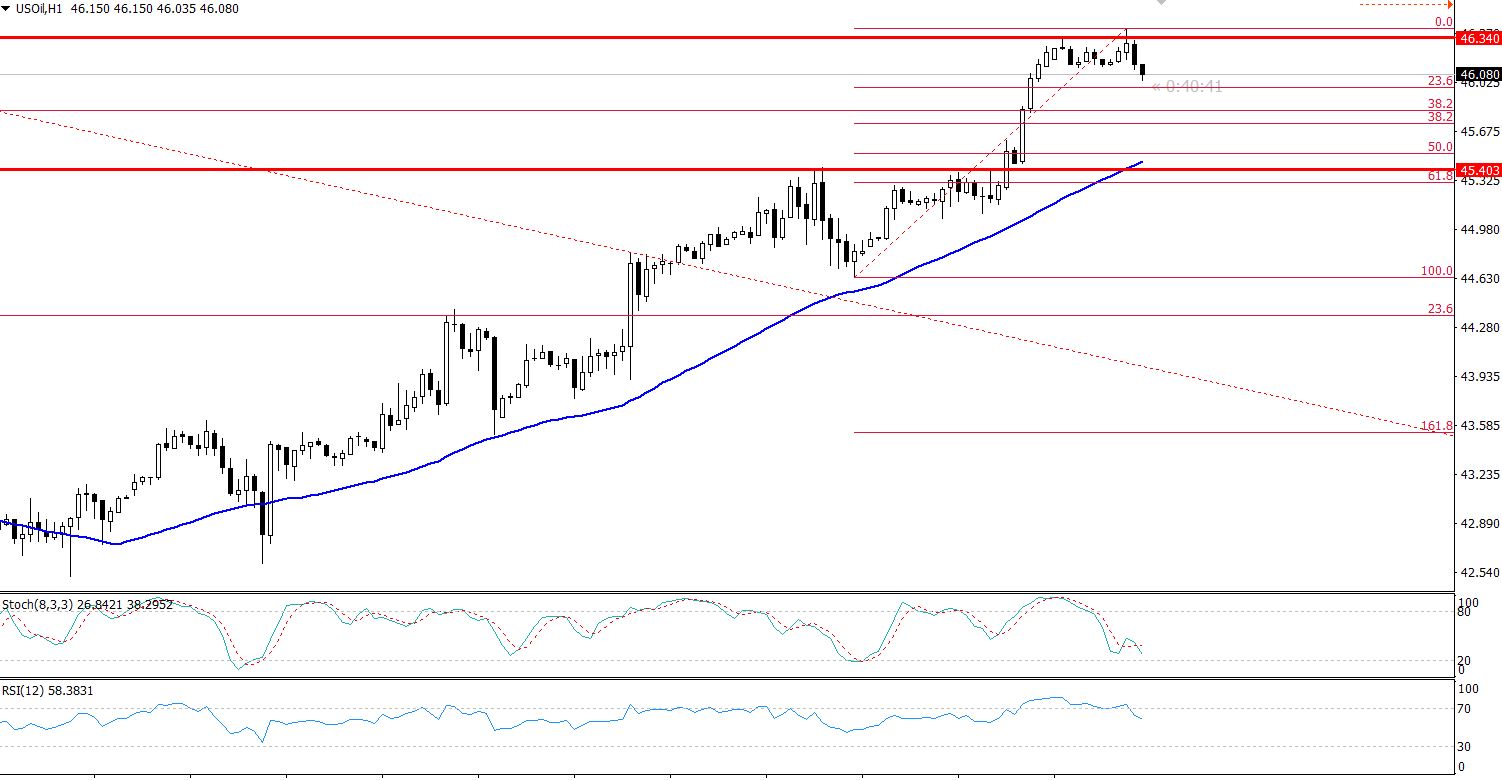
 WTI Crude Oil – Hourly Chart
Technical Outlook – Intraday
Let's have a quick look at the key technical drivers of the market today:
– On the hourly chart, the crude oil has become overbought. The RSI is holding at 74 along with stochastic at 84.
– On the 4-hour chart, the oil is facing a triple top resistance at $46.32. A point of interest is that the oil has formed a couple of Doji's below the same resistance level.
– Although, the market is trading above 50- periods EMA, the prices are far away from the moving average resistance, signifying the potential of a correction in the earlier buyings.
- Check out our free forex signals
- Follow the top economic events on FX Leaders economic calendar
- Trade better, discover more Forex Trading Strategies
- Open a FREE Trading Account


