S&P500 – Sideways Pattern Ready To Breakout!
Today, the US stock markets remained relatively unchanged. The major investors took a break because the New York Stock Exchange remained closed yesterday. Today the investors are back again and we are waiting to see what happens.
Our forex trading signal for the Japanese stocks market index Nikkei closed at take profit during the Asian sessions. In contrast, the US stock markets aren't showing any excitement. I guess we have to wait for the New York session and FOMC meeting minutes. Fingers crossed, as we are already in the trade, floating in profits and loss.
Forex Trading Signal – Idea
We have a buy position in S&P 500 at $2426, with a take profit $2430 and a stop loss of $2422. I will be looking to come out of it before US sessions to avoid unpredictable moves that could result from the FOMC.
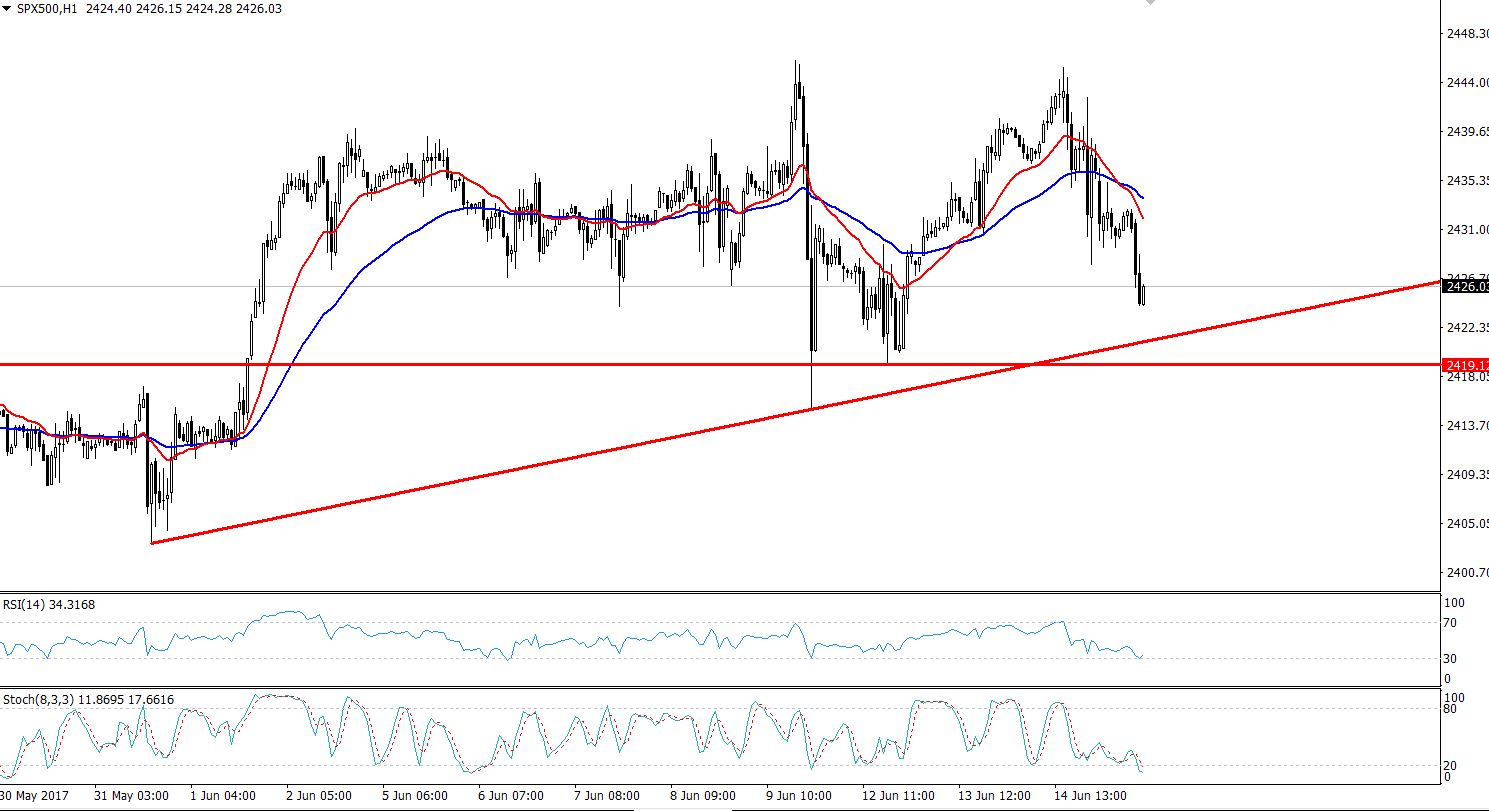
 S&P 500 – Triple Bottom – Hourly Chart
Technical Outlook – Intraday
S&P500 is consolidating in a narrow trading range of $2424 – $2433. The trading is at stake now and can be violated due to the volatility caused by US traders today.
On the hourly chart, the S&P 500 is finding a strong support at $2424, the triple bottom pattern. The pattern signifies potential reversals, so we prefer to take a buy entry here. Good luck!
- Check out our free forex signals
- Follow the top economic events on FX Leaders economic calendar
- Trade better, discover more Forex Trading Strategies
- Open a FREE Trading Account