Can We Get Another Test of 19300 in the Nikkei?
The Nikkei has been grinding its way lower for a few weeks now since US equity markets fell away on the back of both the North Korean drama
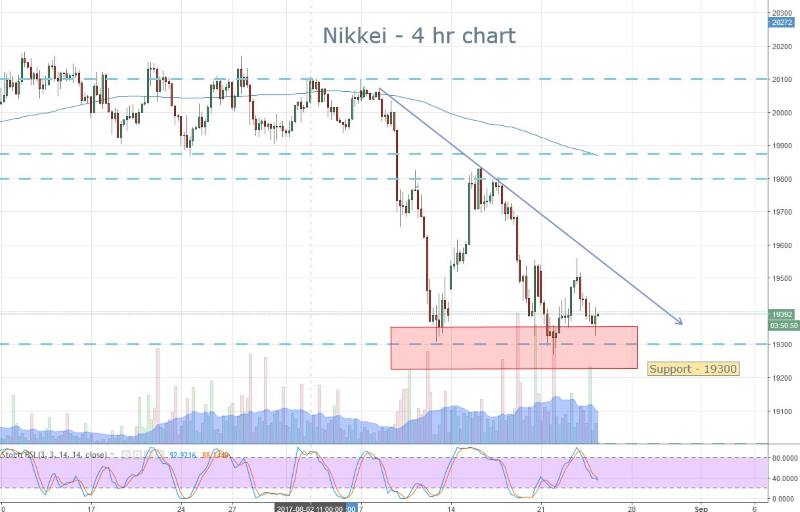
The Nikkei has been grinding its way lower for a few weeks now since US equity markets fell away on the back of both the North Korean drama and the FOMC. At the moment we’ve been unable to to rebound and the trend is certainly down.
It wasn’t all that long away that we were above 20000 and the market was looking strong.
Key Levels in Play
The 200 SMA is one of the most important indicators we have in technical analysis. There’s been a multitude of studies and testing that shows how we can use it as a good long term indicator of trend. Whenever markets (or even stocks) crash, they don’t often do that from above the 200 SMA.
Look back at the GFC and we saw that the market had drifted below its 200 SMA on the daily chart, before the sharp selling began. That’s because news gets factored in slowly over time and it takes a while for sentiment to shift and the bulls to get pushed out by the bears.
That’s why I’m so keen on watching the 19300 level in the Nikkei. At this point we are slightly above the 200 SMA and the range from 19300-19280 is the one we need to break to signal a clear shift in trend.
Given that level of interest it’s a great level to use as support. Keep on buying dips if they present themselves but be mindful of comments from Janet Yellen as the Asian markets always follow the lead of the US.
- Check out our free forex signals
- Follow the top economic events on FX Leaders economic calendar
- Trade better, discover more Forex Trading Strategies
- Open a FREE Trading Account
- Read our latest reviews on: Avatrade, Exness, HFM and XM
Related Articles
Sidebar rates
