Crude Oil Signal Floating in 35 Green Pips – What’s the Next Plan?
Yesterday I opened a forex trade signal to sell at $48.85 and target $48.05. As of now, the signal is doing an excellent job and floating i
Yesterday I opened a forex trade signal to sell at $48.85 and target $48.05. As of now, the signal is doing an excellent job and floating in 35 pips profit. Here is the plan for today.
Technicals Outlook
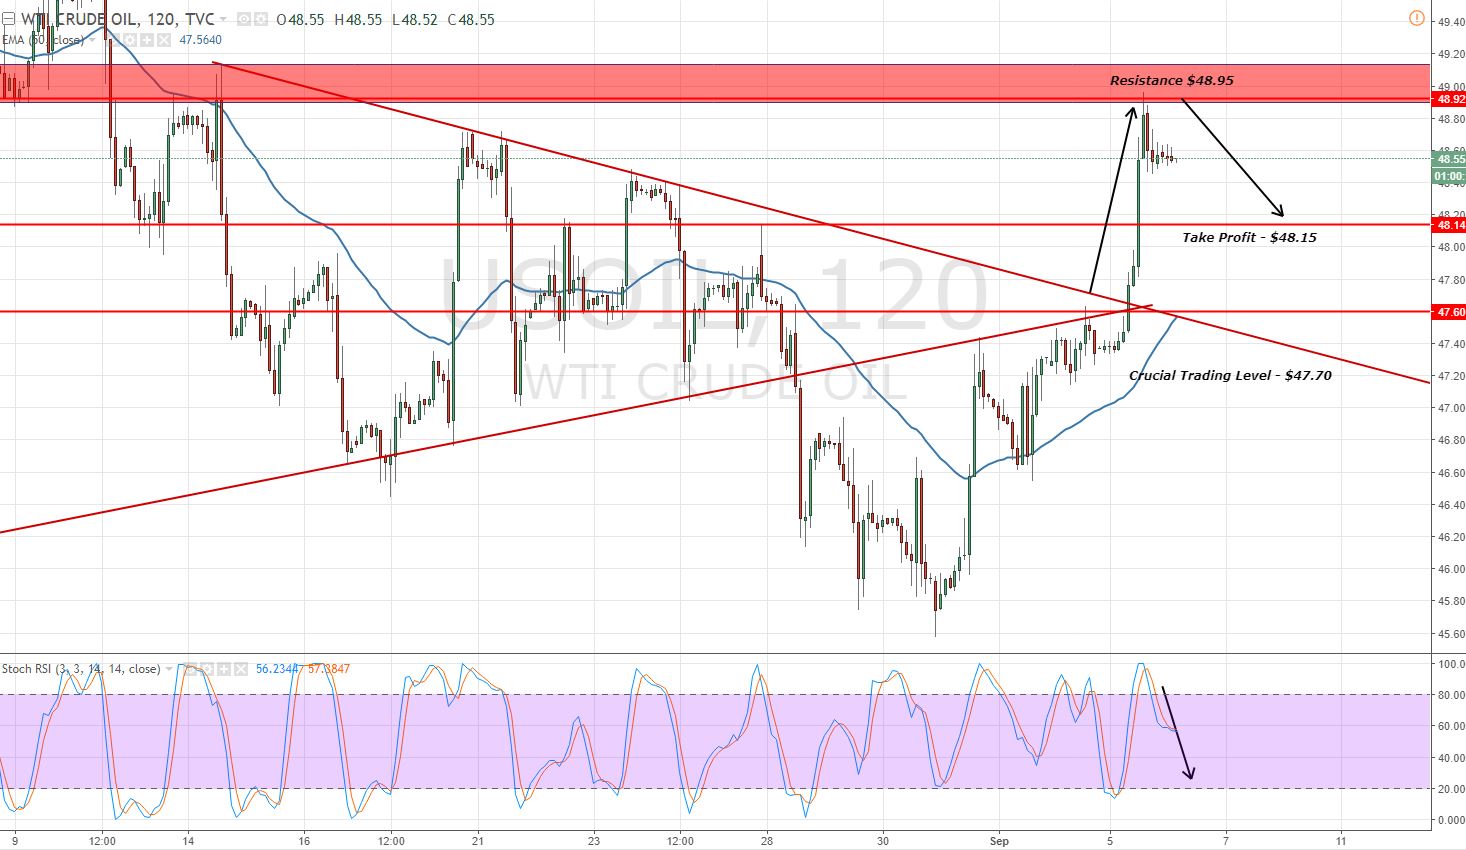
Yesterday, on the breakage of solid resistance $47.60, as over the preceding 24 hours the crude market has shown an additional movement towards normalization as the influence of Hurricane Harvey evaporates.
 Crude Oil – 2- Hour Chart – Fibonacci Retracement
 Crude Oil – 2- Hour Chart – Fibonacci Retracement
In response, the Crude Oil broke above the bearish trend line resistance at $47.70. If you remember, that's the same level where I recommended to enter a trade in my last analysis report.
Anyway, Oil has completed $23.6 Fibonacci retracement at $48.50, and it's expected to go for 38.2% at $48.30. Below this, Oil can go for $48.05 and that's where my take profit is.
Crude Oil Trading Plan
Investors who entered the market at $48.85 are advised to take partial profits now at $48.50, and move their stops to break even ($48.85) and target $48.05 today. Taking another sell position here won't be rational, as the market is holding into a consolidation phase. Good luck fellows and keep following for updates!
- Check out our free forex signals
- Follow the top economic events on FX Leaders economic calendar
- Trade better, discover more Forex Trading Strategies
- Open a FREE Trading Account


