Crude Oil Sideways Pattern at Risk – API Report Awaited!
The Asian trading session is quite dull due to lack of fundamentals and volatility, but the scenario won't remain the same as during the Ne
The Asian trading session is quite dull due to lack of fundamentals and volatility, but the scenario won't remain the same as during the New York session: The API report will cause fluctuations.
API Stockpiles Report
Today at 20:35 (GMT), the API (American Petroleum Institute) will be releasing the Crude Oil inventories for the previous week. The analysts expect a 2.925 million barrels build in crude. Whereas, on Wednesday, the official data from the Energy Information Administration EIA) is due. The API and EIA figures often diverge, and this provides us the trade opportunity.
Technical View
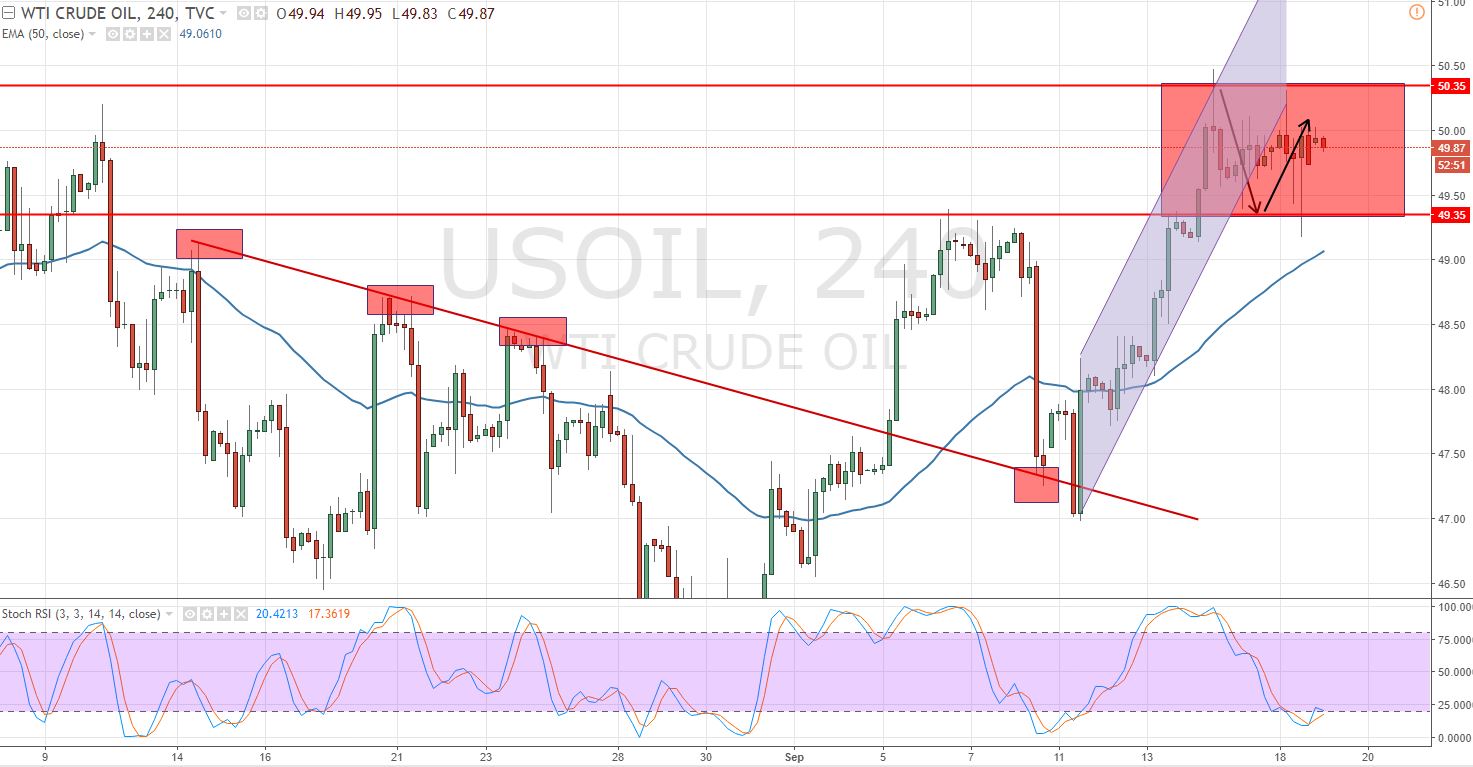
The Crude Oil has traded sideways, so the technical outlook remains the same as before. It's still trading in the narrow trading range of 100 pips ($49.30 – $50.30). Honestly, the hourly and 4-hour chart is neutral and will give us an opportunity to trade the breakout in the U.S. session. It's because the investors are waiting for some fundamental reason (API report) to get in the market. Did you hear about news trading? Check out the FX Leader News Trading Strategy to get quick profits on fundamentals.
 Crude Oil – 4 Hour Chart – Sideways Trend
 Crude Oil – 4 Hour Chart – Sideways Trend
 At the moment, Crude can find support at $49.80 and $49.40. While the resistance can be found at $50 and $50.45.
Crude Oil Trading Plan
The idea is to take a quick sell below $49.75 to target $49.40 and $49.25. On the other hand, buying above $50 with a target of $50.45 is preferred. Good luck.
- Check out our free forex signals
- Follow the top economic events on FX Leaders economic calendar
- Trade better, discover more Forex Trading Strategies
- Open a FREE Trading Account


