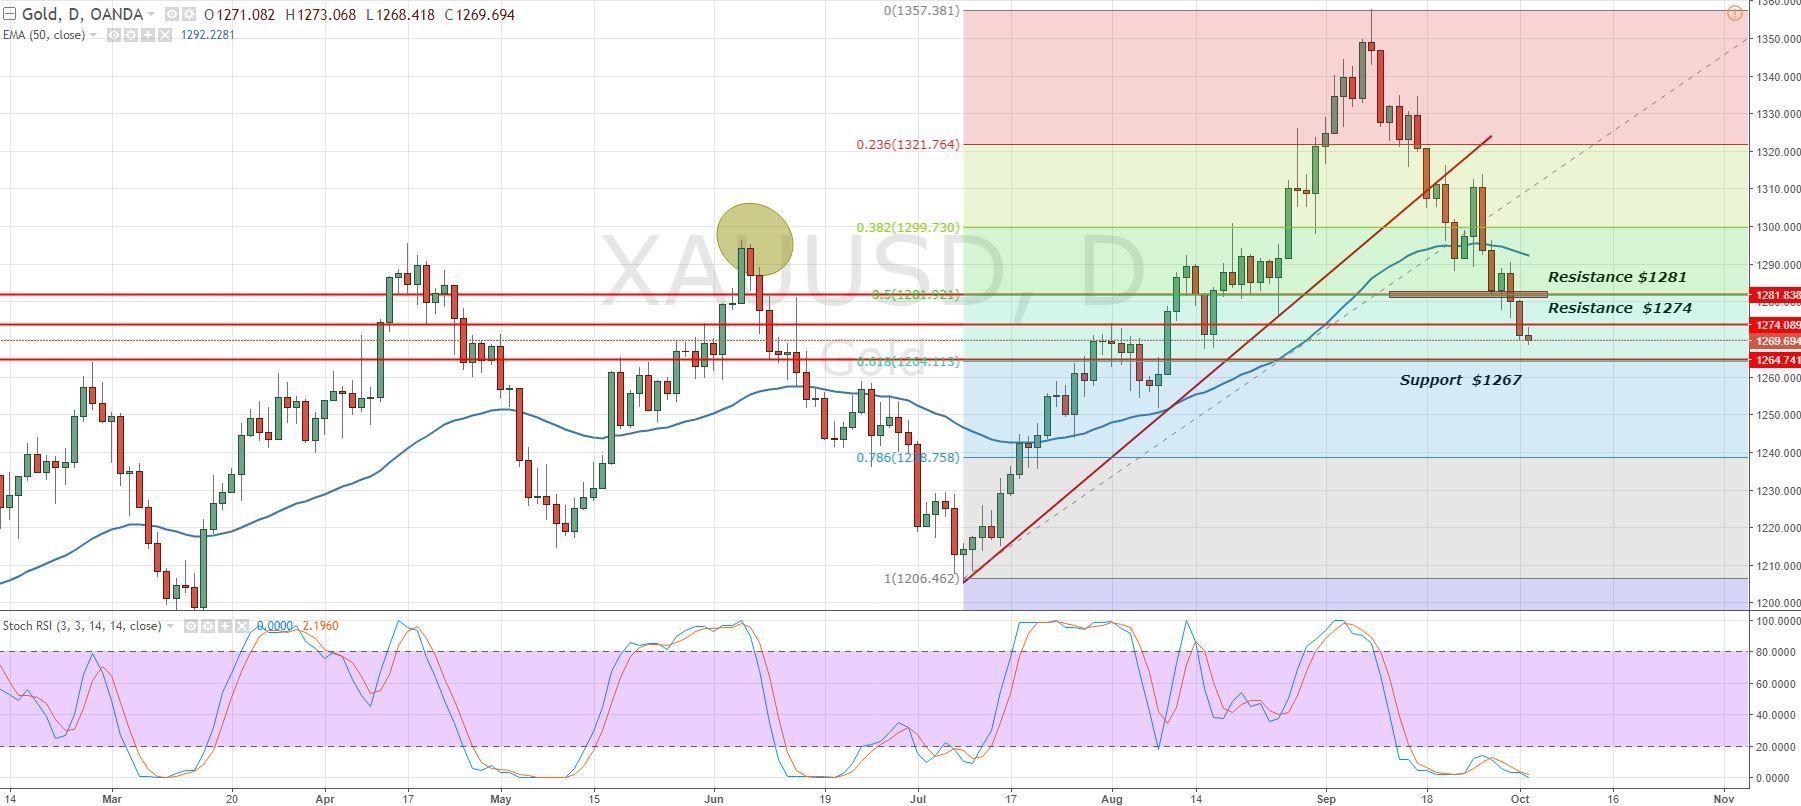
Oct. 3 – 61.8% Fibonacci Retracement in the Gold
What’s up traders. Yesterday, a terrible event in Las Vegas shook the global markets. My colleague Shain explained the event's implicatio
What’s up traders. Yesterday, a terrible event in Las Vegas shook the global markets. My colleague Shain explained the event's implications on the market – Tragedy In Las Vegas: A Look At Risk-Off. Although the impact was short-lived, it was enough to hit our stop in GBPJPY. Surprisingly, the Gold had a muted impact.
Gold – Technical View
Reviving my earlier update, Oct. 2 – Bearish Gold – Reversal or Retracement. Our Forex Trading Signal on Gold floated in +40 pips profit, but unfortunately, it ended up closing at stop loss overnight. The reason we always recommend risk and money management is to secure yourself from unexpected reversals.
 Gold – Daily Chart – Fibonacci Retracement
At the moment, I'm focusing on the daily chart of the Gold. The bearish momentum is quite strong. Gold is about to form "Three Black Crows" candlestick pattern which signifies a potential of the bearish trend. If this happens, the Gold will hit $1,262 by the end of today. Gold prices are trading below 50 periods moving averages at $1,295 along with momentum indicators in the heavily oversold situation.
Lastly, the metal is on its way to complete 61.8% Fibonacci retracement at $1,262, and it may pull back from here. Check out FX Leaders Fibonacci trading strategy to avoid the trap in wrong trades.
Gold Trading Plan
The scenario is bit different today as compared to a day before. I'm not looking for any long-term trade due to uncertainty in the market. Today, $1,274 seems to be a good level to sell, and $1,262 is a good level to take buy positions. Good luck and trade with care!
- Check out our free forex signals
- Follow the top economic events on FX Leaders economic calendar
- Trade better, discover more Forex Trading Strategies
- Open a FREE Trading Account
 Gold – Daily Chart – Fibonacci Retracement

