WTI Crude Oil – Head & Shoulder Pattern In Action
Crude Oil is on my radar today as the economic events from the world's top Oil consumer are likely to signal an upcoming demand. Yup, I'm t
Crude Oil is on my radar today as the economic events from the world's top Oil consumer are likely to signal an upcoming demand. Yup, I'm talking about the United States. We have trade balance and factory orders on the docket today.
Why Crude Oil Fell On EIA Report?
Yesterday, the EIA inventories decreased by -6.0 million barrels from the previous week. As per this data, the Crude Oil was supposed to get bullish and it actually showed some bullish waves. But the bullish trend was short lived as the draw in inventories didn't come as surprise.
Recalling my previous update WTI Crude Oil – Top Economic Event & Trade Idea, we predicted the outcome of EIA report. That's why the market was already "priced in" and Oil reversed despite the -6M draw in inventories.
Technical View – Head & Shoulder Pattern
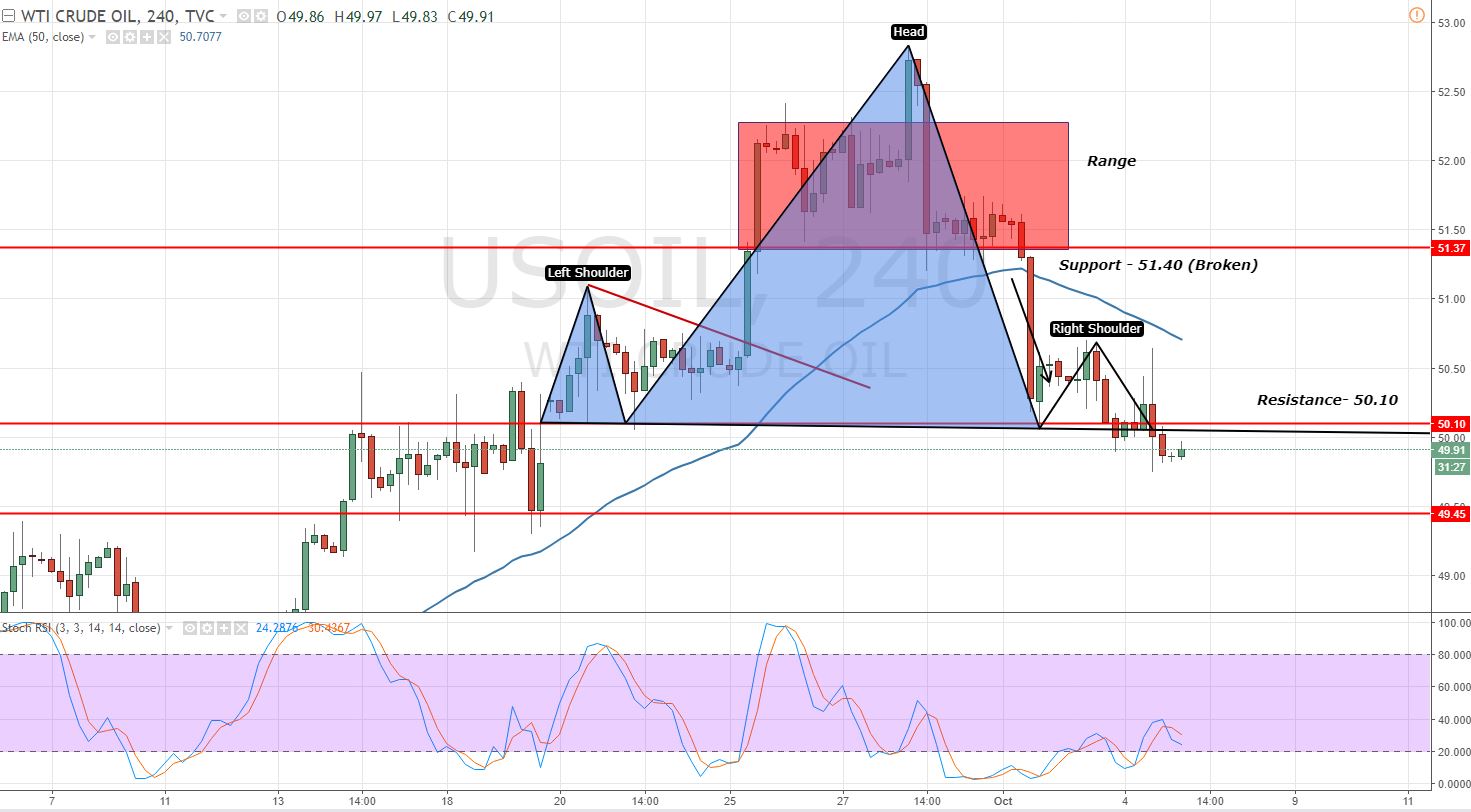
On the 4- hour timeframe, the Oil has formed a head and shoulder pattern. The pattern just completed the right shoulder at $50.10. Yup, $50.10 is the same level which was in our focus in a previous couple of updates.
 Crude Oil – 4- Hour Chart – Head and Shoulder Pattern
This opens a room for further sell up to $49.35. But wait, it's not as simple as it looks like. Don't forget about economic events today as the Oil movement is highly depending upon the economic events discussed in the beginning.
WTI Crude Oil – Trading Plan
Today, $50.10 looks like a crucial trading level to determine the bullish and bearish trend. I would like to stay in sell below this level with a target of $49.50. Good luck!
- Check out our free forex signals
- Follow the top economic events on FX Leaders economic calendar
- Trade better, discover more Forex Trading Strategies
- Open a FREE Trading Account
 Crude Oil – 4- Hour Chart – Head and Shoulder Pattern

