Forex Afternoon Brief: Trading Levels For The USD/CHF And USD/CAD
The USD is currently under pressure across the majors. Substantial corrections in the USD/CAD, EUR/USD, and USD/CHF are apparent. This deve
The USD is currently under pressure across the majors. Substantial corrections in the USD/CAD, EUR/USD, and USD/CHF are apparent. This development is a good thing, as we have several levels defined for the remainder of the U.S. session.
The causes for today’s weakness in the USD are multifold. One catalyst for the action was the set of underperforming metrics from earlier. Specifically, the IBD/TIPP Economic Optimism index came in way under expectations. If you check out your intraday charts, the weakness in the USD at 10:00 AM EST is evident.
Volatility is a good thing for short-term traders, and today’s action has set up some trade opportunities moving forward.
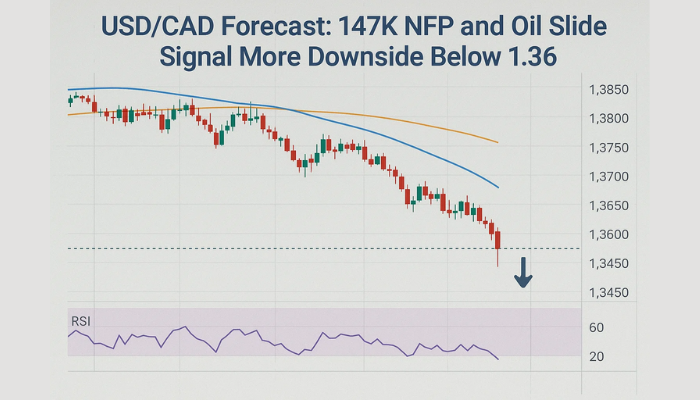
USD/CAD
The USD/CAD has sold-off since the bullish read from last week. Here is the technical roadmap:
 USD/CHF, Daily Chart
++8_24_2017+-+10_10_2017.jpg) USD/CHF, Daily Chart
USD/CHF, Daily ChartThere are a few technical areas to be cognizant of as we move forward into the trading week:
-
Support at the Bollinger Band MP and 20 Day EMA 1.2437-1.2433.
-
Topside resistance at the 78% level of 1.2530.
Overview: The USD/CAD is a commodity pair, with a correlation to crude oil pricing. Today’s breakout in WTI crude, coupled with weak U.S. economic metrics, have strengthened the CAD. I expect to see rotation between our support levels at 1.2437-1.2433 to the 78% retracement of 1.2530.
Trade Idea: The support levels will change dramatically on today’s close. Taking a long from this area today is a great trade, but one that will likely remain elusive. A short from the 78% resistance level more probable.
A short from 1.2530 with a stop above Monday’s high is a solid 1:1 or 1:2 position trade moving forward.
USD/CHF
The scenario for the USD/CHF is very similar. However, the USD/CHF is prone to enter rotation and we have a clearly defined zone.
USD/CHF
++8_30_2017+-+10_10_2017.jpg) USD/CHF
USD/CHF
A few key technical levels:
-
Support at .9702-.9700 with the 20 Day EMA and Bollinger MP.
-
The key level of .9800 is serving as topside resistance.
-
The 38% retracement of 2017’s range is an important area and a likely magnet for price action.
Overview: It is probable that this market will continue to tighten between .9800 and .9700. As we go deeper into the week, a defined rotational strategy will be available. Be sure to check back for the levels and trading plan.
Trade Idea: For now, I recommend longs from the support level of .9702-9700 and shorts from .9800. These trades being elected today is unlikely, but the coming sessions will give a sharper image of the week’s trading range.
Bottom Line: This week’s trade of the USD depends greatly upon Friday’s CPI release. With a bit of luck, these two markets will give us high-probability opportunities in the meantime.
- Check out our free forex signals
- Follow the top economic events on FX Leaders economic calendar
- Trade better, discover more Forex Trading Strategies
- Open a FREE Trading Account