
⚡Crypto Alert : Altcoins are up 28% in just last month! Unlock gains and start trading now - Click Here


It's been quite a nice experience trading cross-currency pairs, especially, the one with Japanese Yen. This week, the volatility has remained quite low for a simple reason. Yup, I'm talking about North Korea and the United States cold war.
Key Technical Points:
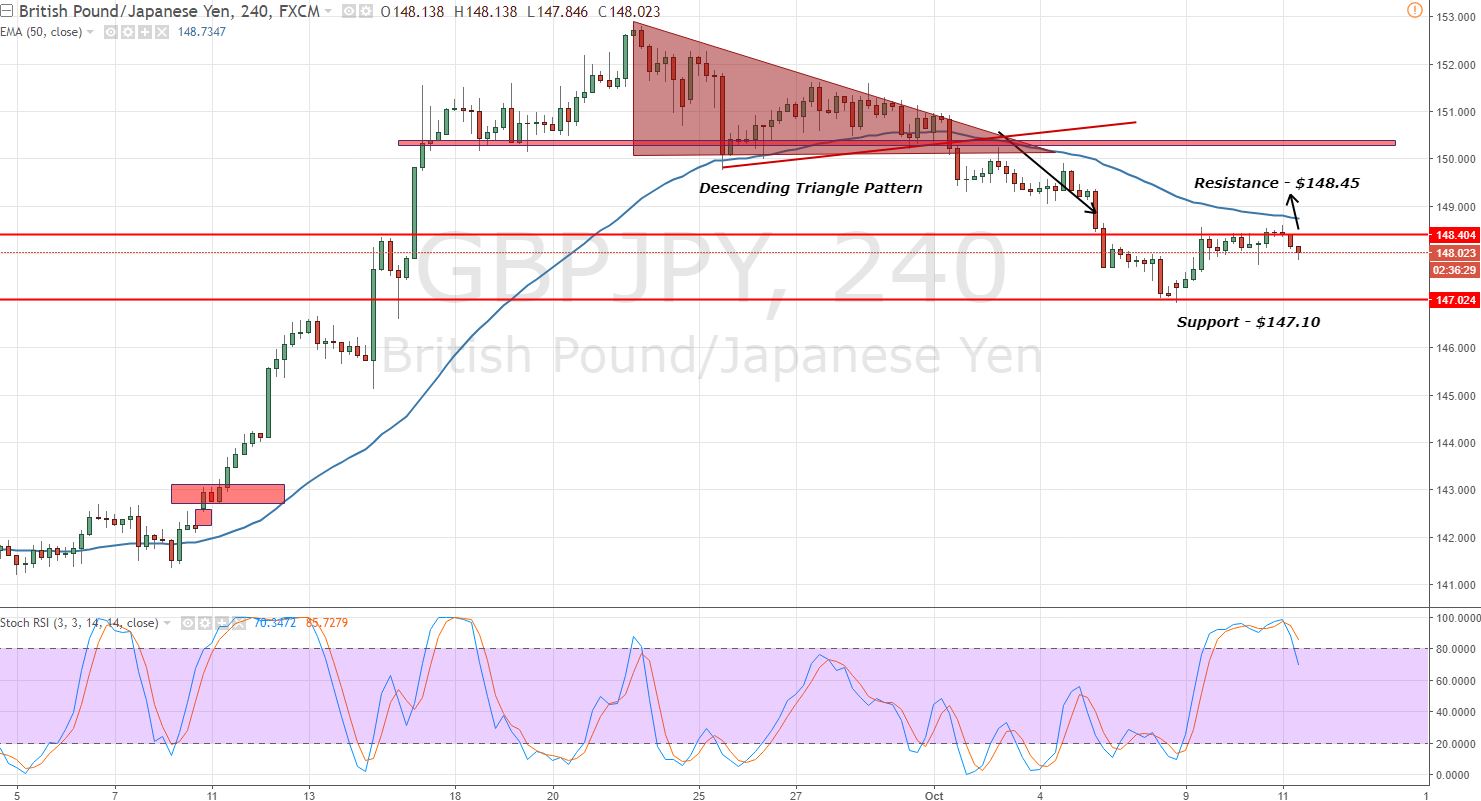
- The GBPJPY has broken below the ascending triangle pattern and since then, the pair is trading bearish.
- On the 4- hour timeframe, the pair has entered the oversold region. Look at the Stochastics and RSI, both of them are holding above 80.
 GBPJPY – 4- Hour Chart – Sideways Range
 GBPJPY – 4- Hour Chart – Sideways Range
- The 50- periods EMA is resisting the pair at $148.75. GBPJPY needs to show us a crossover before turning to the bullish trend.
- Lastly, the pair is stuck into the narrow range of $147 – $148.45. We can't say much which side the pair is going to breakout. All we can do is to wait for the breakout before placing any trade. Else, the trade will be a risk.
GBPJPY – Trading Idea
Today, $148.250 is an important level for GBPJPY. It will be nice to stay in sell below this level with a target of $147.65. Good luck!
Check out our free forex signals
Follow the top economic events on FX Leaders economic calendar
Trade better, discover more Forex Trading Strategies
Related Articles


Comments
Subscribe
Login
0 Comments


