ABCD Pattern Completed – Should We Sell WTI Crude Oil?
The EIA inventories failed to surprise the Oil traders as most of them are out on holiday for Thanksgiving or Black Friday. The technical s
The EIA inventories failed to surprise the Oil traders as most of them are out on holiday for Thanksgiving or Black Friday. The technical side is quite interesting and sooner or later there will be a good trade.
Fundamentals Overview
The Energy Information Administration reported a draw of -1.9M which was slightly higher than the forecasted -1.4M., but the Oil remained intact.
One of the reasons Crude Oil faced resistance is the US Sales Orders of Capital Goods which unexpectedly fell in October. The drop in US sales came after three consistent months of hefty gains. The US, as a top consumer of Crude Oil, surely influences the investor's sentiment regarding future demands. As a result, the Oil prices remain unchanged despite the drop in inventory figures.
Technical View
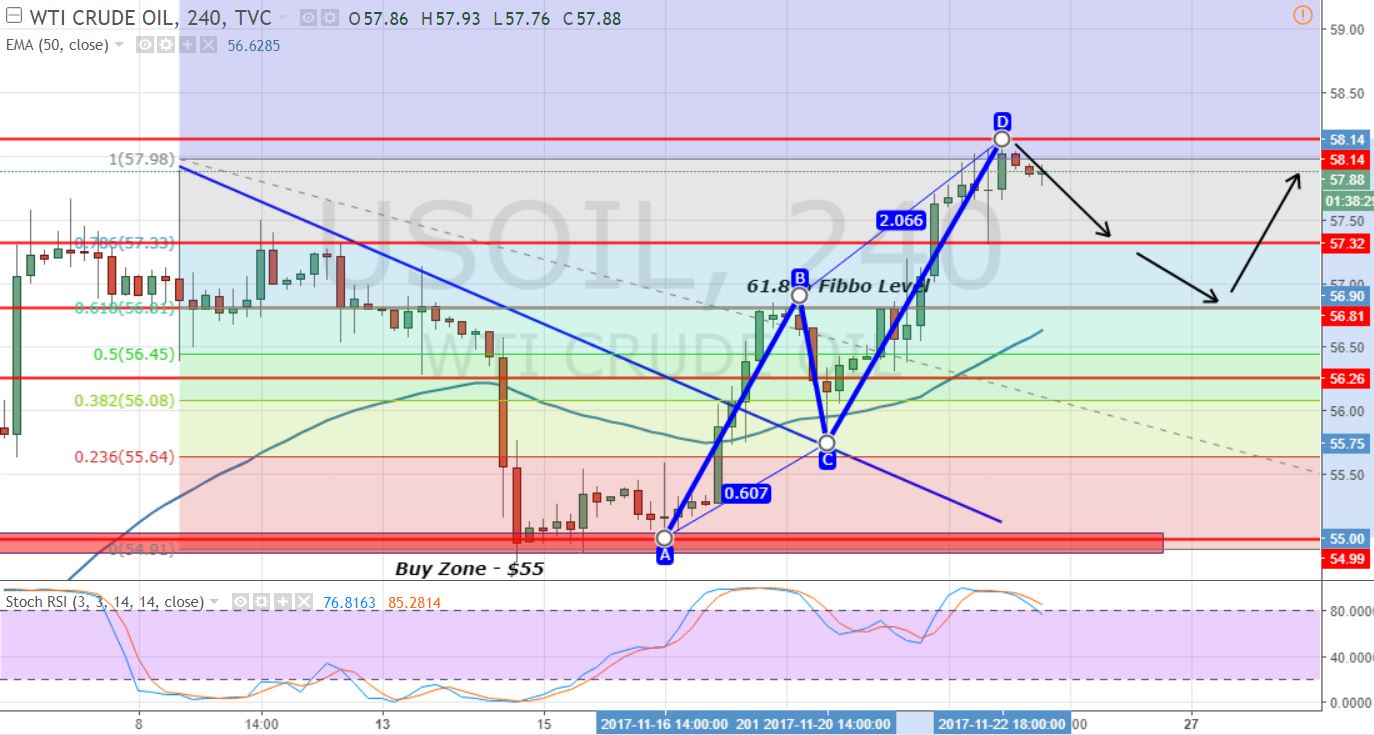
Crude Oil has formed an ABCD pattern on the 4-hour chart. It just completed the C to D leg at $58. Technically, the bearish ABCD pattern leads to selling trends. Hence, we can expect a sell-off in the overbought Crude Oil.
 Crude Oil – ABCD Pattern
 Crude Oil – ABCD Pattern
 For now, we need to keep an eye on $58 as it's providing solid resistance. Whereas, it's likely to face an immediate support at $57.35 and $56.85. That's where I would like to place a buy.
WTI Crude Oil – Trading Plan
I'm looking to stay in sell below $58 with a stop above $58.25 and a take profit of $57.45 and $57. Good luck!
- Check out our free forex signals
- Follow the top economic events on FX Leaders economic calendar
- Trade better, discover more Forex Trading Strategies
- Open a FREE Trading Account
- Read our latest reviews on: Avatrade, Exness, HFM and XM
Related Articles
Sidebar rates
