Is It Good Time To Buy Falling WTI Crude Oil?
Crude Oil begins the week with huge drop in prices due to fundamental reasons. However, things aren't very clear as there is a divergence between the technical and fundamental sides. Check out our Forex Trading Signal on Crude Oil.
Fundamentals Overview
The recent drop in Oil prices was caused due to uncertainty over a possible continuation of output cuts by major crude producers and expectations of higher supply as the Keystone pipeline restarts.
Later today at 21:35 (GMT), the API will be releasing the weekly inventories. If you remember, last week the API reported a draw of more than 6M barrels in inventories which initiated bullish trend in the Oil.
For the moment, I don't see any forecast of the report but in my opinion, the draw will be lesser than the previous week. As a result, the Oil prices may get bullish. But wait, it's just a logical guess, so we should wait for the report today before placing a trade.
Technical View
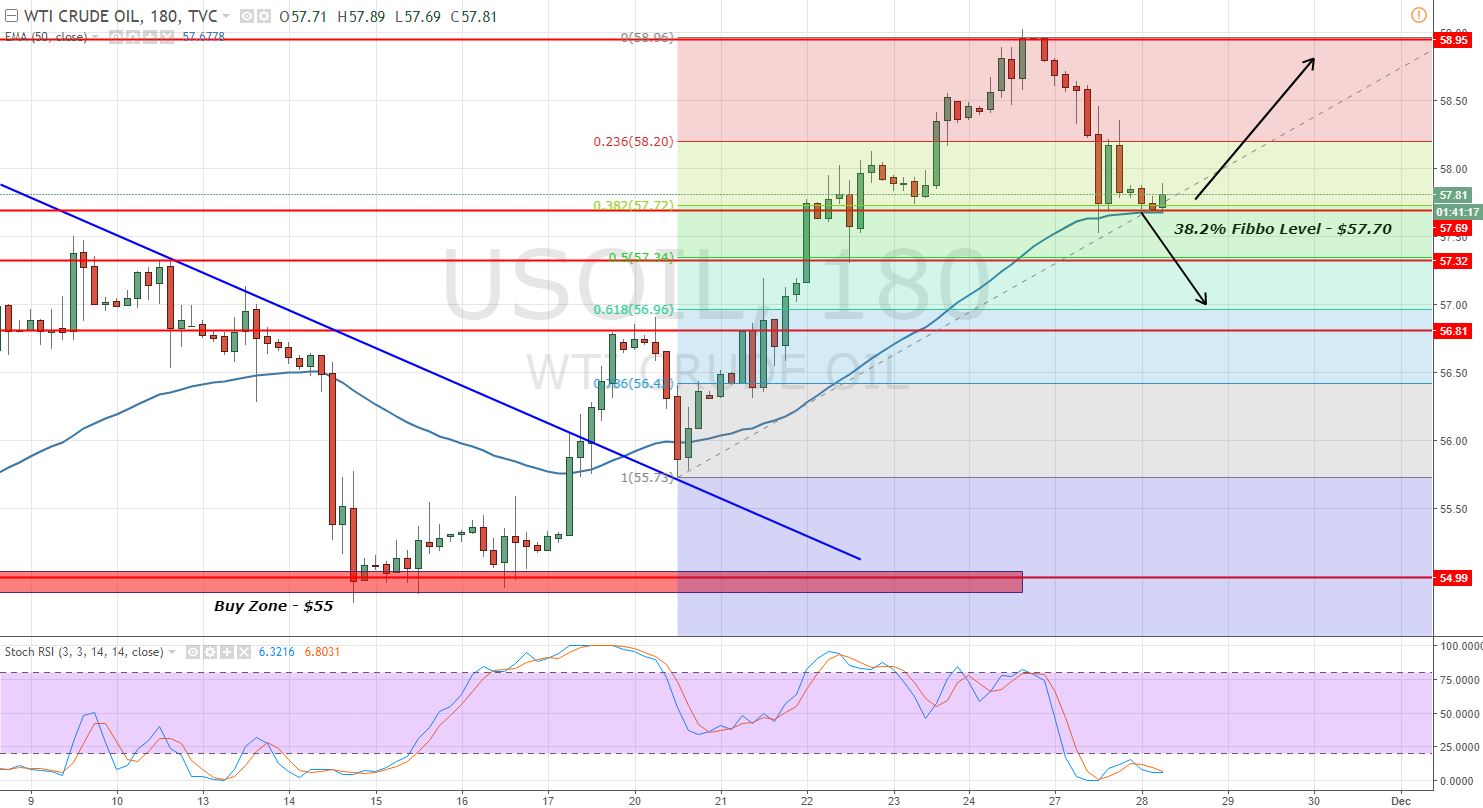
We just shared a Forex Trading Signal to catch quick 25 Pips in the Crude Oil. Let's swiftly move to the 3- hour chart of Crude Oil. It has completed 38.2% Fibonacci retracement at $57.70.
 Crude Oil – 3 – Hour Chart
Crude Oil has tested $57.70 twice, making it a double bottom level. Alongside, the leading indicators are trading below 20 which means soon or later the bears are going to take profit in Crude Oil. That's when we'll get our profits.
WTI Crude Oil – Trading Plan
We shared a trading signal to stay bullish above $57.70 with a stop below $57.45 and a take profit of $58 and $58.20. Good luck and be cautious of API report today.


 Crude Oil – 3 – Hour Chart


