Bitcoin (BTC) Breaks Below Horizontal Support – Check Out The Next Buying Level
Since a couple of weeks, the chief cryptocurrency Bitcoin is under attack by the bears...
Since a couple of weeks, the chief cryptocurrency Bitcoin is under attack by the bears. Ethereum, on the other hand, is making solid gains. Let’s take a quick look at the technical sides of Bitcoin.
BTC/USD – Horizontal Support Breakout
Fellas, if you look at the 4 – hour chart, the BTC has broken below the solid support level of $14,500 and it’s likely to head towards $13,480. The bearish momentum gain strength specifically after the 50- periods EMA bearish crossover at $15, 600.
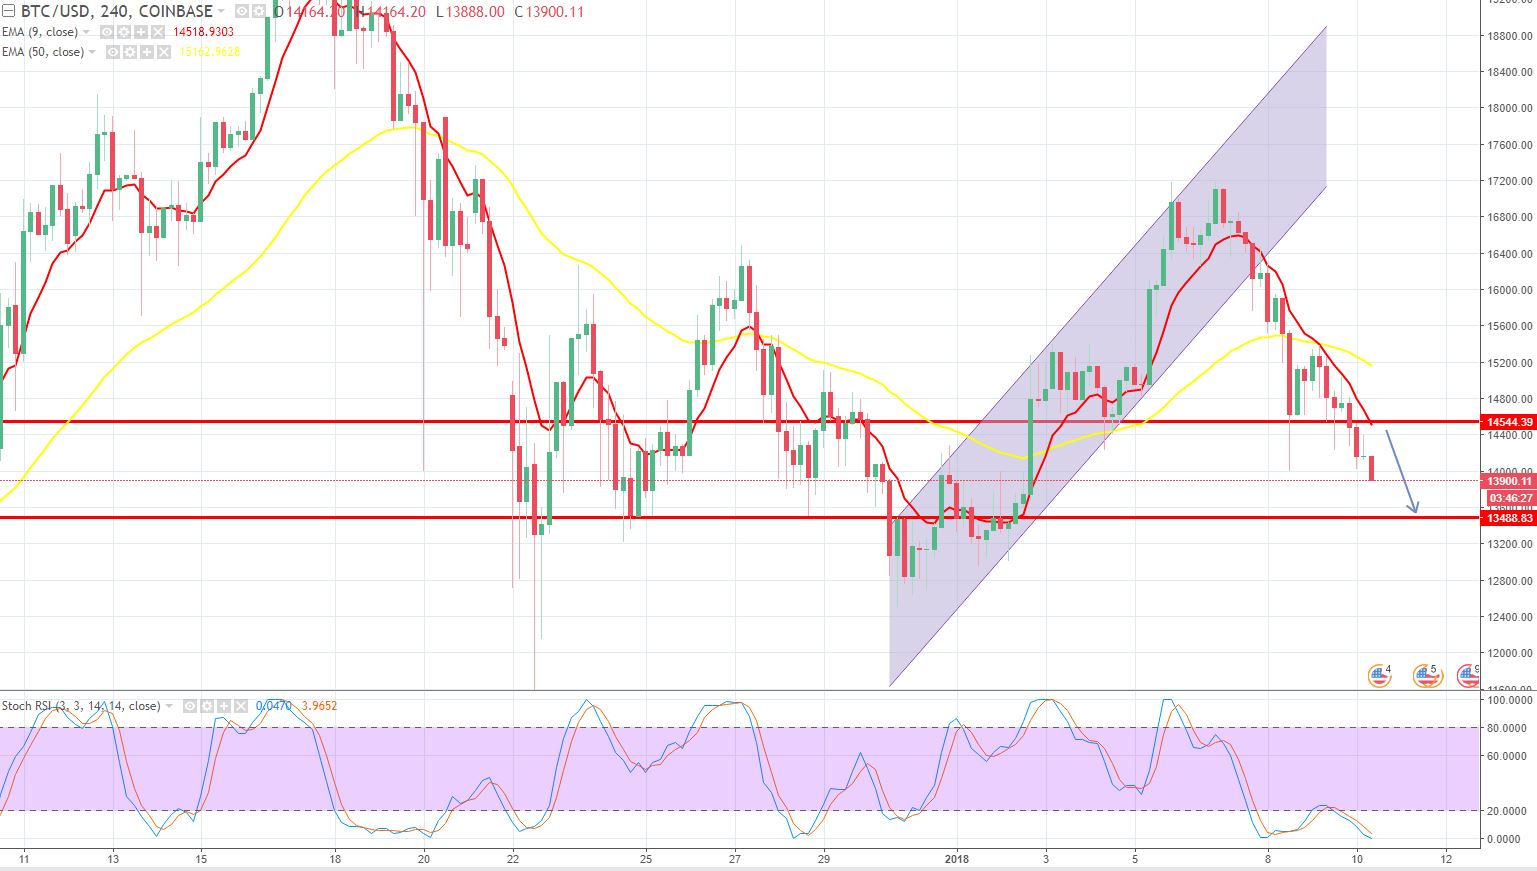
BTC/USD – 240 – Min Chart
Key Technical Levels – BTC/USD
Support Resistance
14,125 15,035
13,844 15,316
13,389 15,770
Key Trading Level: $14,580
BTC/USD – Trade Idea
Staying bearish below $14,580 seems to be a good idea with a stop above $14,850 and a take profit of $13,050 and $12,850. Conversely, bulls can get in the trade right above $12,850. Stay tuned, we will be sharing the forecast on ETC/USD very soon. Good luck.
- Check out our free forex signals
- Follow the top economic events on FX Leaders economic calendar
- Trade better, discover more Forex Trading Strategies
- Open a FREE Trading Account
- Read our latest reviews on: Avatrade, Exness, HFM and XM
Related Articles


Sidebar rates
Related Posts
