WTI Crude Oil Turns Bearish On Two Bearish Patterns
Crude Oil is supported on the signs that production cuts by OPEC and Russia are stretching supplies...
Earlier in the Asian session, our forex trading signal on Crude Oil closed at a stop. The idea was to encash the breakout setup, but the breakout ended at being the fakeout. Overall the Crude Oil is supported on the signs that production cuts by OPEC and Russia are stretching supplies, however, we can’t ignore the surging production in the United States.
WTI Crude Oil – Technical Analysis
The technical side of the market has turned bearish. Let’s look at the 4- hour chart, you can see the bearish reversal pattern called tweezers top. Besides that, the WTI Crude Oil has formed a double top pattern at $64.55, our initial buying level.
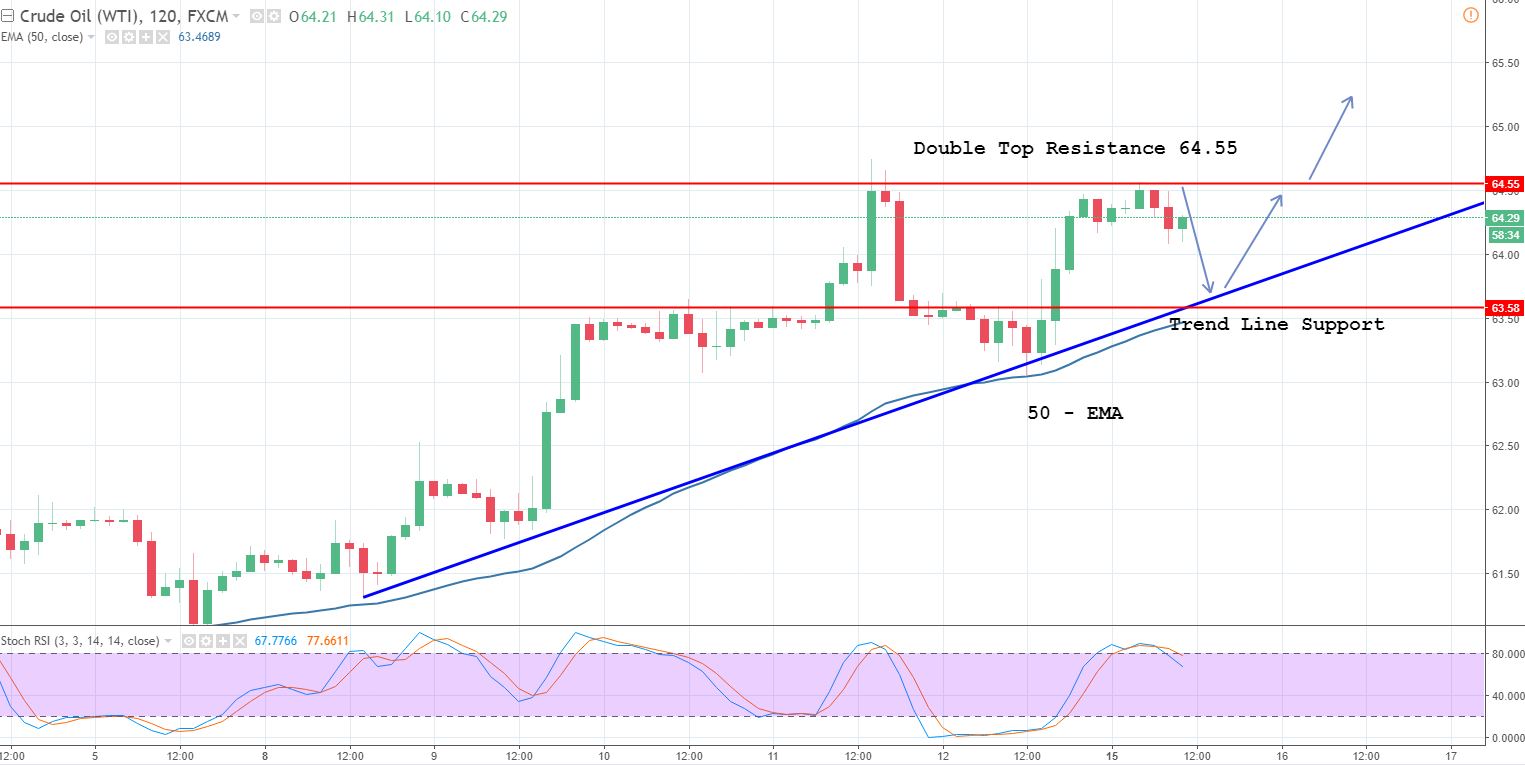
WTI Crude Oil – 2- Hour Chart
The Stochastics has started coming out of the overbought region (below 80), signifying the commodity needs retracement before it continues bulls trend. Watch out the key technical levels to watch out today.
Support Resistance
64.16 64.41
64.05 64.55
63.91 64.66
Key Trading Level: 64.3
WTI Crude Oil – Trading Plan
I’m looking to enter another trade below $64.35 with a stop above $64.65 and take profit at $63.95. Stay tuned for more updates.
- Check out our free forex signals
- Follow the top economic events on FX Leaders economic calendar
- Trade better, discover more Forex Trading Strategies
- Open a FREE Trading Account


