Jan 16 – Top Economic Events & Trade Setups
Today, the Sterling is likely to offer us some good trade opportunities. So, buckle up to ride the volatility...
Good morning, fellas. Yesterday’s markets remained uncertainly volatile. The greenback softened across the board and it seems like dollar bears don’t want to rest despite the holiday in the US. Today, the Sterling is likely to offer us some good trade opportunities. So, buckle up to ride the volatility…
Today’s Economic Events
Great Britain Pound – GBP
CPI y/y – The Office for National Statistics will release Inflation figures at 9:30 (GMT). The CPI shows the change in the price of goods and services purchased by consumers.
Logically, the increased prices show increased demand and increased demand shows good labor market. When both, the labor market and inflation is on the track, we can expect central banks to hike the interest rates. Even if we don’t see a rate hike, investors still trade the currency with the bullish sentiment.
PPI Input m/m – Though less important than CPI, we need to make sure that it’s not releasing widely different than the forecast. Overall, it’s also a leading indicator of consumer inflation. When manufacturers pay more for goods, the higher costs are usually passed on to the consumer.
U.S. Dollar – USD
Empire State Manufacturing Index – Today at 13:30 (GMT), the Federal Reserve Bank of New York will be releasing the empire state manufacturing index. It’s expected to be 18.5 vs. 18. A figure above 0 indicates improving conditions, while below 0 indicates worsening conditions.
Today’s Top Trade Setups
GBP/USD – Consolidation Zone – Investor’s Awaits CPI Figures
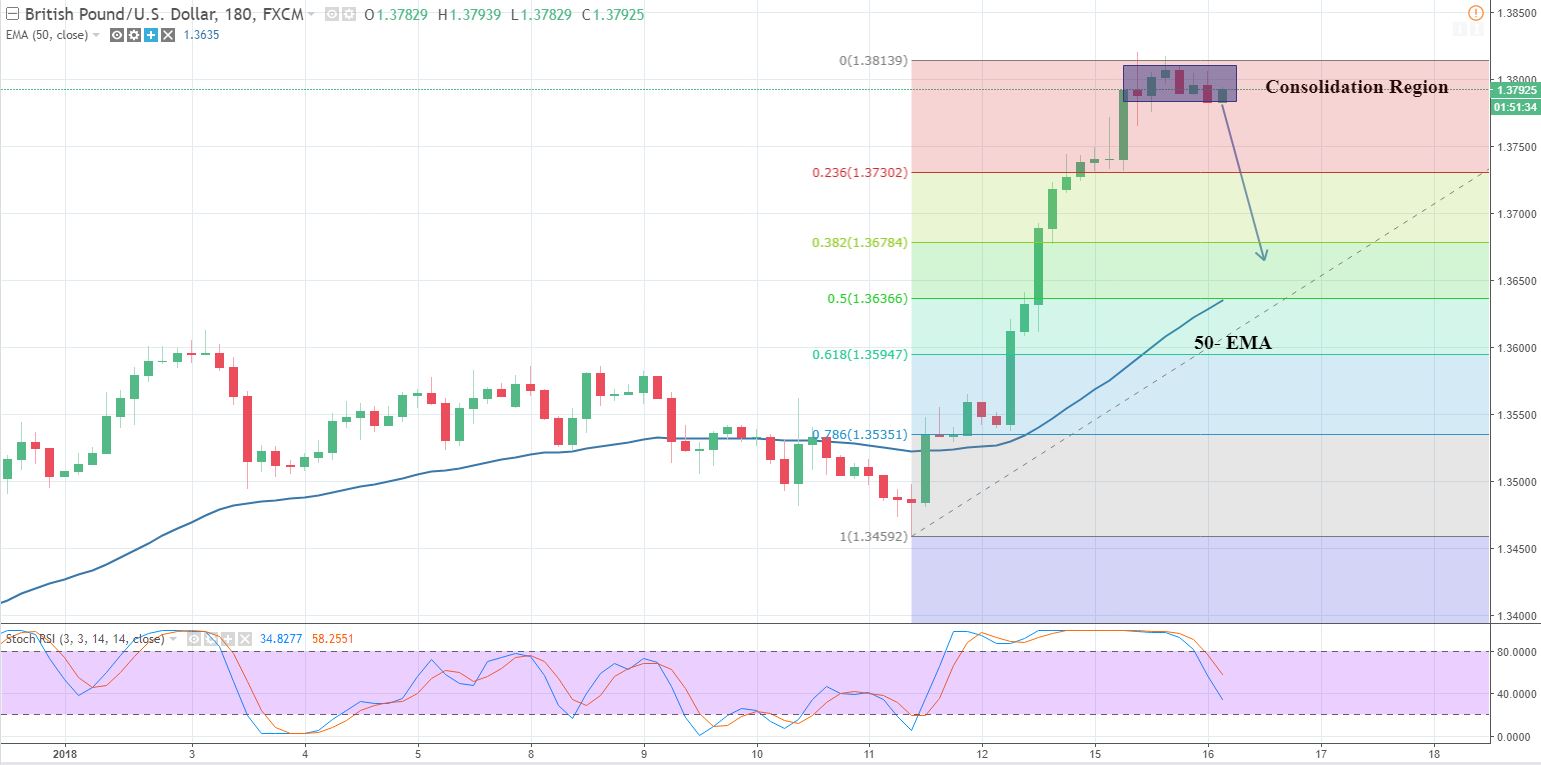
On the 3 – hour chart, you can see the Cable is taking a breather below $1.3815. This is because of the high impact news from the UK, the inflation data. Traders would like to see the CPI release, before committing themselves to any specific direction.
GBP/USD – 3 – Hour Chart
The positive figures will cause a bullish breakout until $1.3830 and $1.3875. Whereas, the negative data will push the pair deeper towards $1.3735.
Support Resistance
1.3737 1.3833
1.3681 1.3873
1.3641 1.3929
Key Trading Level: 1.3777
GBP/USD Trade Plan
Monitor $1.3775, below this we may see massive selling until $1.3735 and $1.3680. On the other hand, we can stay bullish above $1.3780. It’s all depends on the UK CPI figures later today.
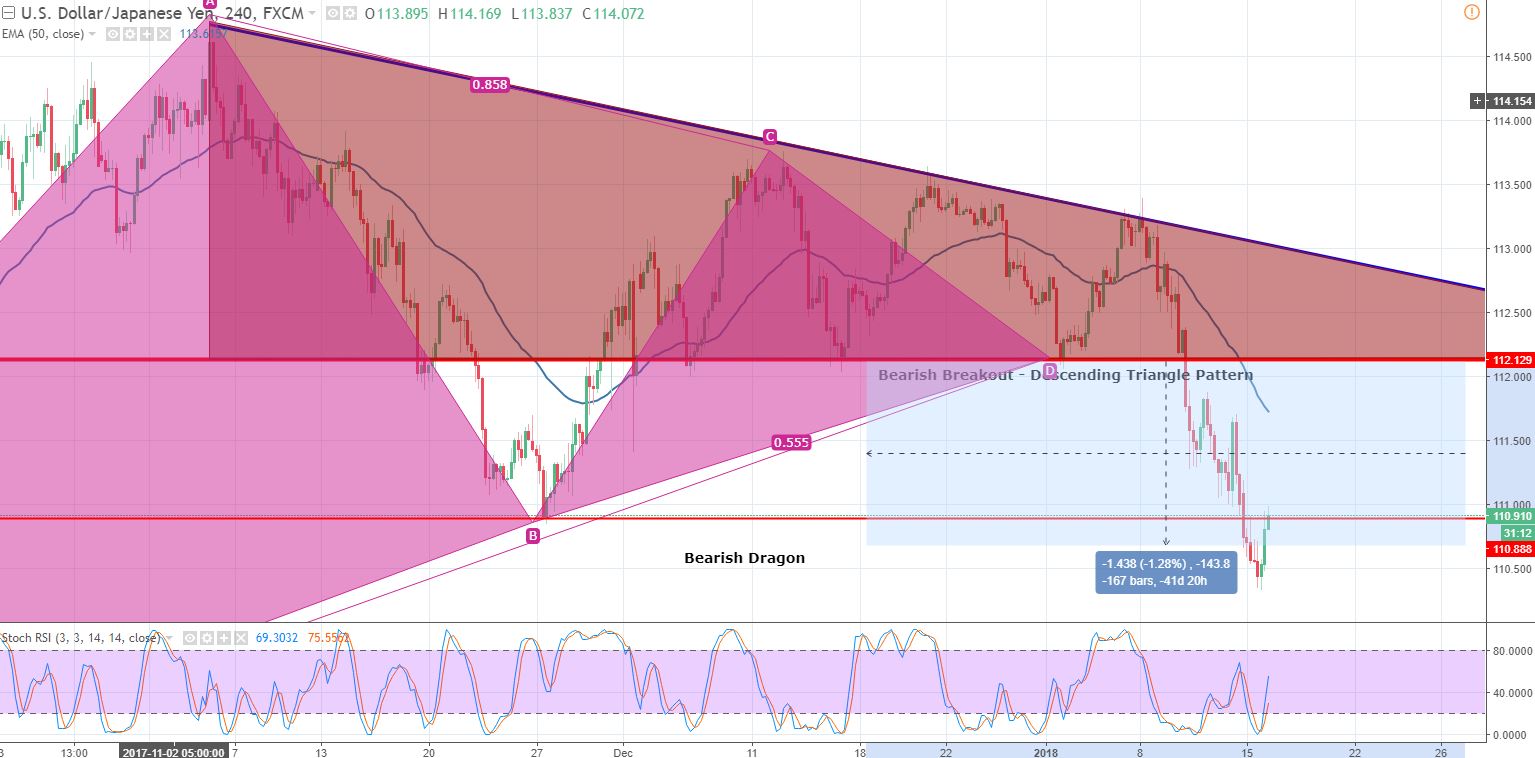
USD/JPY – Descending Triangle Pattern
The safe haven currency Japanese Yen is one a winner for two reasons:
– Hawkish Monetary policy sentiments from the Bank of Japan.
– The breakout in Descending Triangle pattern
USD/JPY – 4 – Hour Chart
The JPY became oversold and has started coming out of the oversold range. All we need to do is to wait for a pullback to get another selling entry in the pair. As soon as the market retraces back to $111.250, we may see another drop until $109.600.
USD/JPY – Key Trading Levels
Support Resistance
110.17 111.03
109.82 111.54
109.31 111.89
Key Trading Level: 110.68
USD/JPY Trading Plan
The idea is to stay bullish above $110.70 with an initial take profit of 111.020 and 111.275. $111.300 looks like a good level to take a sell position. Good luck!
- Check out our free forex signals
- Follow the top economic events on FX Leaders economic calendar
- Trade better, discover more Forex Trading Strategies
- Open a FREE Trading Account


