Bitcoin (BTC) Standstill- Bullish Gartley Ready To Roll
Despite the ongoing regulatory issue in South Korea, the Crypto market is still holding in place....

Despite the ongoing regulatory issue in South Korea, the Crypto market is still holding in place. Bitcoin’s price rose slightly from yesterday but failed to break the $12,000 wall. Here’s a quick technical view on BTC.
BTC/USD – Technical Outlook
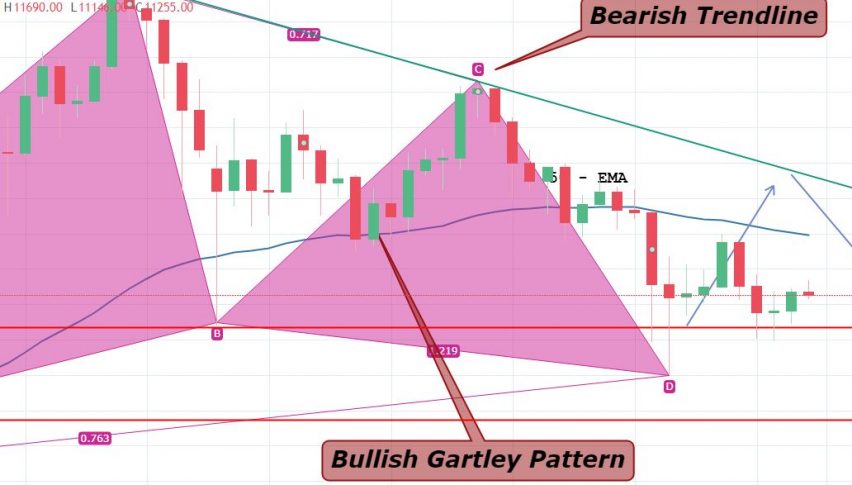
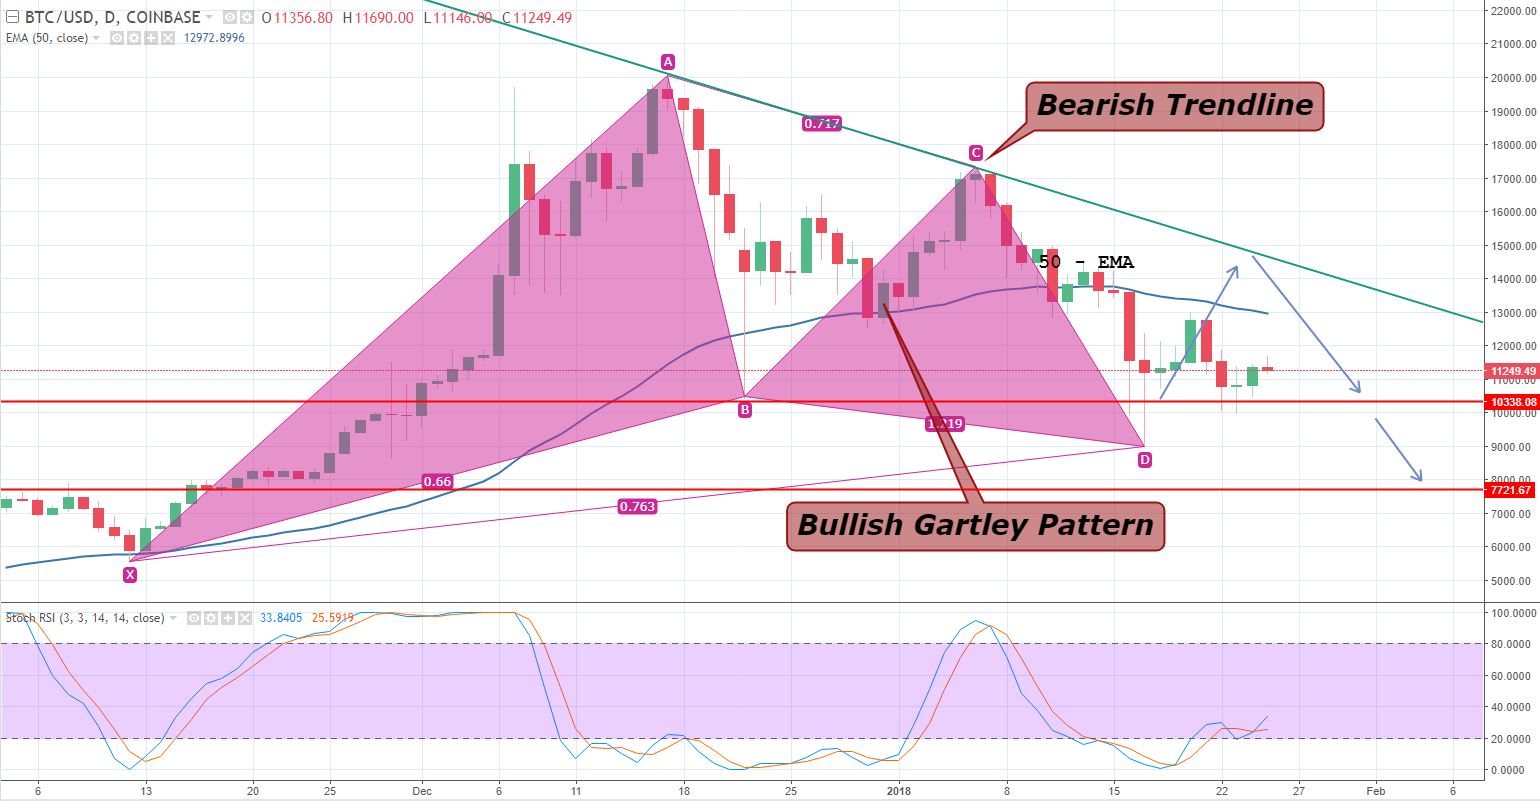
On the daily chart, the BTC has formed a bullish pattern called “Bullish Gartley”. The pattern has completed the C to D wave at the $9,000 level, and Bitcoin has been trading above the same level since last week.
BTC/USD – Daily Chart
The leading indicators are holding in the oversold zone, indicating the potential for a bullish retracement. I would highly suggest the strong support level of $10,335, as the coin is bullish until the market is above this level. Below $10,335, we may see an additional selling trend until $7,721.
Support Resistance
10770.7 11739.9
10159.3 12097.5
9801.6 12709
Key Trading Level: $11,128.4
BTC/USD – Trade Idea
The current idea is staying bullish above $11,125, with a stop below $10,100, and take profit at $12,250, and $14,150. Good luck and have a profitable day!
- Check out our free forex signals
- Follow the top economic events on FX Leaders economic calendar
- Trade better, discover more Forex Trading Strategies
- Open a FREE Trading Account


