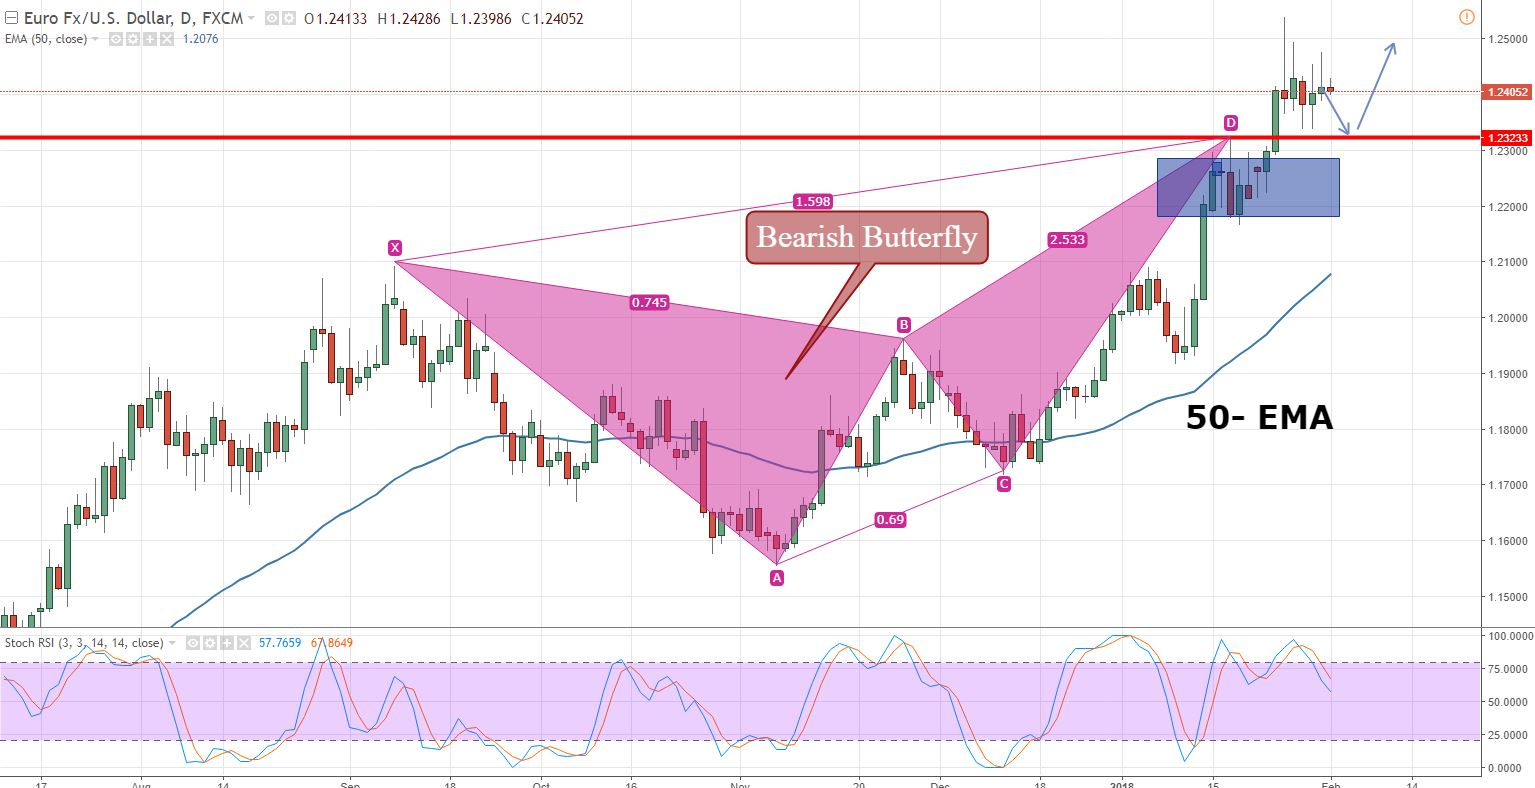
EUR/USD Violates The Bearish Butterfly To Form the Fresh Range
As expected, during their January meeting, the Fed (Federal Reserve) kept interest rates on hold....

As expected, during their January meeting, the Fed (Federal Reserve) kept interest rates on hold. They did , however, make the statement hawkish by stating that inflation is likely to rise this year. In response, we saw bullish trends in the dollar.
Since the release of FOMC, the major currency pair EUR/USD has been trading with a bearish sentiment. Last week, the EUR/USD violated the bearish harmonic pattern called the ”bearish butterfly pattern.” The pattern’s C to D wave was completed at $1.2300, and the pair was expected to stay bearish below this. Closings above $1.2300 suggest the bullish bias of investors.
EUR/USD – Daily Chart
EUR/USD – Key Trading Levels
Support Resistance
1.2377 1.2465
1.2338 1.2514
1.2289 1.2553
Key Trading Level: 1.2426
For now, the Euro is likely to face support at 1.2385 and 1.2335, while having resistance at 1.2425.
EUR/USD Trade Plan
Investors are advised to keep a close eye on $1.2380, as below this, the EUR/USD can give us a selling opportunity with a target of 1.2345. Above 1.2380, we may see bulls dominating the market. Good luck!
- Check out our free forex signals
- Follow the top economic events on FX Leaders economic calendar
- Trade better, discover more Forex Trading Strategies
- Open a FREE Trading Account


