Feb 20 – Good Day to Trade Forex Technical Setup, Economic Events Remains Light


Good morning, traders.
As we discussed yesterday, the trading remained relatively low on New York session as most of the US investors were out due to President’s Day holiday. Despite that, our forex trading signals managed to get quite a good number of pips in DAX, Gold and EUR/JPY.
Today, the economic calendar doesn’t have much to offer us, therefore, trading the technical setups will be a real fun.
Top Events to Watch Today
Eurozone – EUR
German ZEW Economic Sentiment – The Zentrum fur Europaische Wirtschaftsforschung will release the data at 10:00 (GMT). The data is expected to drop to 16.5 vs. 20.4. Therefore, the single currency Euro is likely to stay under pressure today.
New Zealand – NZD
GDT Price Index – It’s a leading indicator of the nation’s trade balance with other countries because rising commodity prices boost export income. The figure rose by 5.9% on Feb 6, the forecast and time of release isn’t mentioned yet.
Top Trade Setups Today
GBP/USD – Descending Triangle Pattern
The Cable continues to trade bearish after testing the downward trendline resistance at $1.4140. Now the Sterling is likely to gain support above 1.3940. We can see on the 4- hour chart below, the 50- periods EMA is holding near 1.3940 in order to support the direct currency pair.
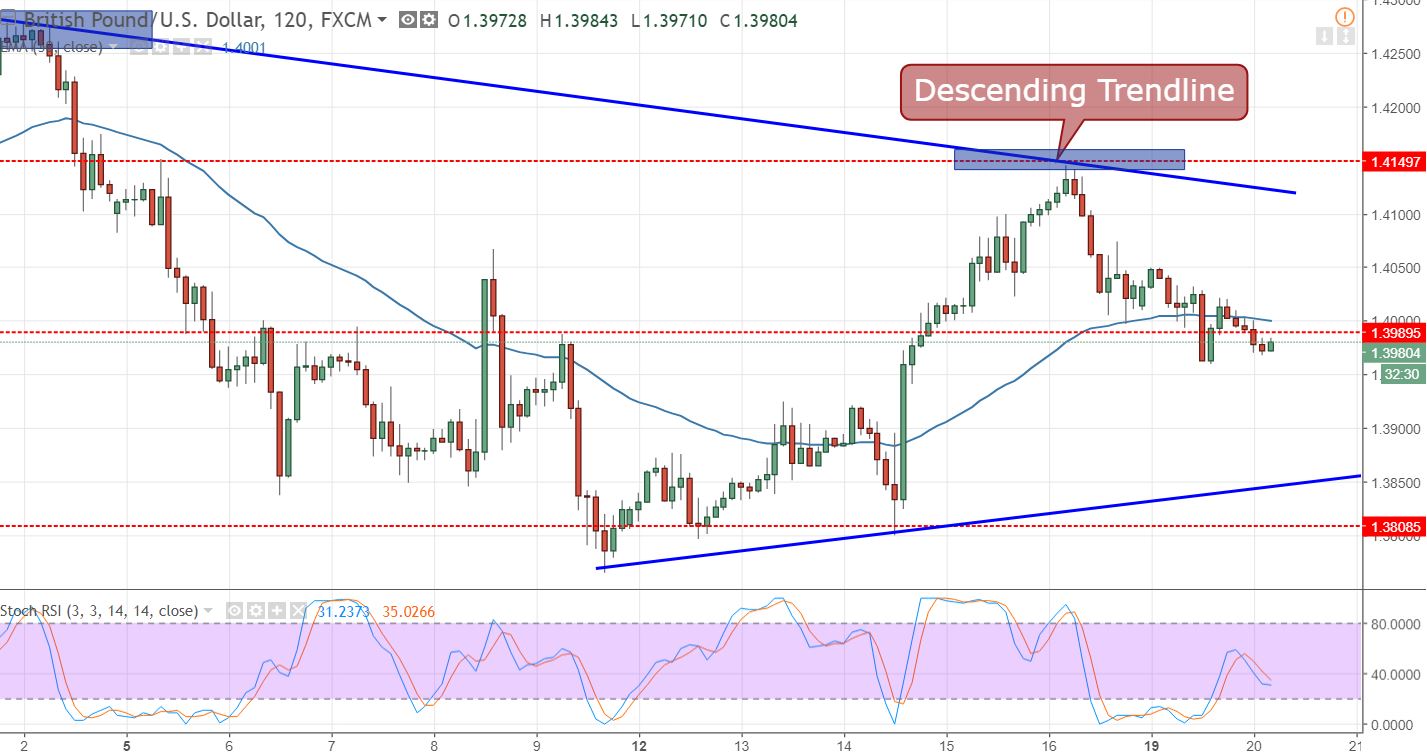
GBP/USD – 120 Min Chart
GBP/USD – Key Trading Levels
Support Resistance
1.3951 1.4041
1.391 1.409
1.3861 1.4131
Key Trading Level: 1.4000
GBP/USD Trade Plan
Investors are advised to keep a close eye on $1.4005, below this, the GBP/USD can give us a selling opportunity with a stop above $1.4055 and take profit at $1,3940. On the other hand, $1.3915 seems to be a good trading level to open the buying position.
USD/JPY – Oversold Pair Retracing Back
Over the period of two weeks, the Japanese cross has dropped more than 450 pips due to boosted demand for haven assets and weakness in the dollar. But now it looks like the bears are exhausted and have started taking profit.

USDJPY – Daily Chart
Check out the daily chart, the RSI and Stochastics are massively oversold below 80 and the hammer candle followed by a strong bearish trend is indicating a potential for a bullish reversal.
I just applied a Fibonacci indicator on the daily chart, the USD/JPY is likely to complete 38.2% retracement at 107.435. My friends, If you are wondering how to trade below levels, do check out FX Leaders Support and Resistance strategy for better profits.
USD/JPY – Key Trading Levels
Support Resistance
106.3 106.94
105.88 107.16
105.66 107.58
Key Trading Level: 106.52
USD/JPY Trading Plan
Today, the idea is to stay bullish above $106.500 with a stop below $106.350 and take profit at $107.200. Good luck and keep following for exciting trade ideas and forex trading signals.
Good luck!