Crude Oil Starts its Fall: Time to Sell?
Crude Oil has fallen away sharply for a second day, thanks to an increase in oil inventories. We saw that domestic crude supplies rose by 3 million barrels for the week ended Feb. 23, according to the EIA.
That meant WPI took a turn and the bull trend that has been in place in recent weeks is starting to slow down.
Over the course of the month, it was a wild ride as we fell from $66 all the way down to $58.
Key Levels for Oil
Yesterday I was looking for a break below 62.43. We smashed through that level with relative ease. That was my first bear indicator. From that point onwards we are now moving towards the next major level which is 61.00.
There’s every chance that we will see a head and shoulders pattern form if we get any kind of bounce of 61.00. That is yet another bearish sign and I expect to see some more selling coming in.
We will have more data to work with when we get the latest US rig count figures which I suspect will see an increase.
The rising USD has also continued to put pressure on commodities as a whole and with an interest rate rise in March, all but a certainly there might be some more pain ahead.

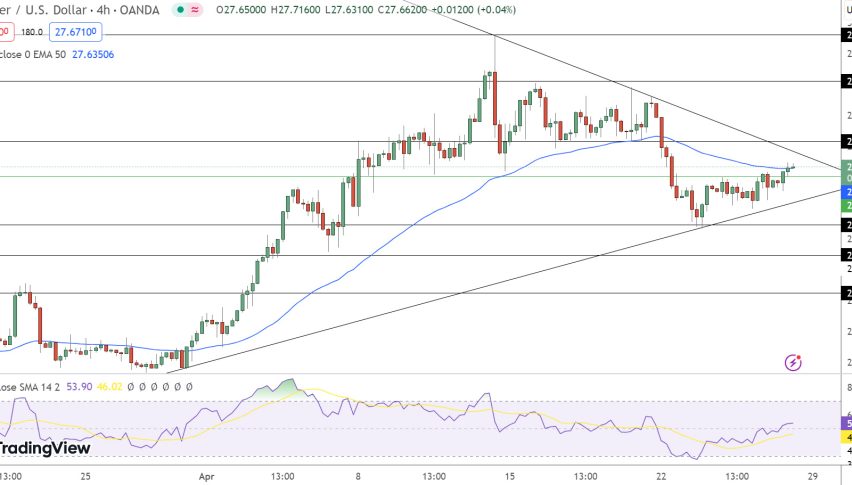
Crude Oil – 240 min Chart.


