Gold: An Intense Battle Between Bulls and Bears!
There has been a clear attempt by investors to break out of the tight trading range of $1315 - $1,327, with no success...
For the past few days, Gold is consolidating in a sideways channel as investors are unable to find any solid reason to move the market. In the meantime, Gold formed an interesting technical setup to trade. Are you up for it?
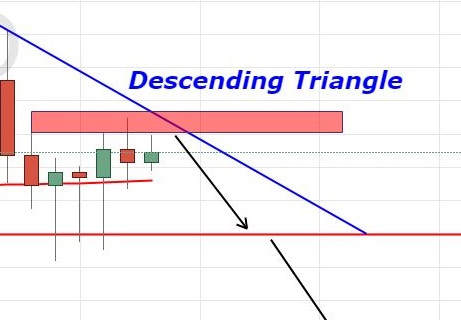
Technical Overview – Descending Triangle Pattern
There has been a clear attempt by investors to break out of the tight trading range of $1315 – $1,327, with no success. Now Gold is closing neutral candles such as a Doji and a Spinning Top, a sign of an indecision among bulls and bears. Check FX Leaders Candlesticks Strategy to learn more about these patterns.
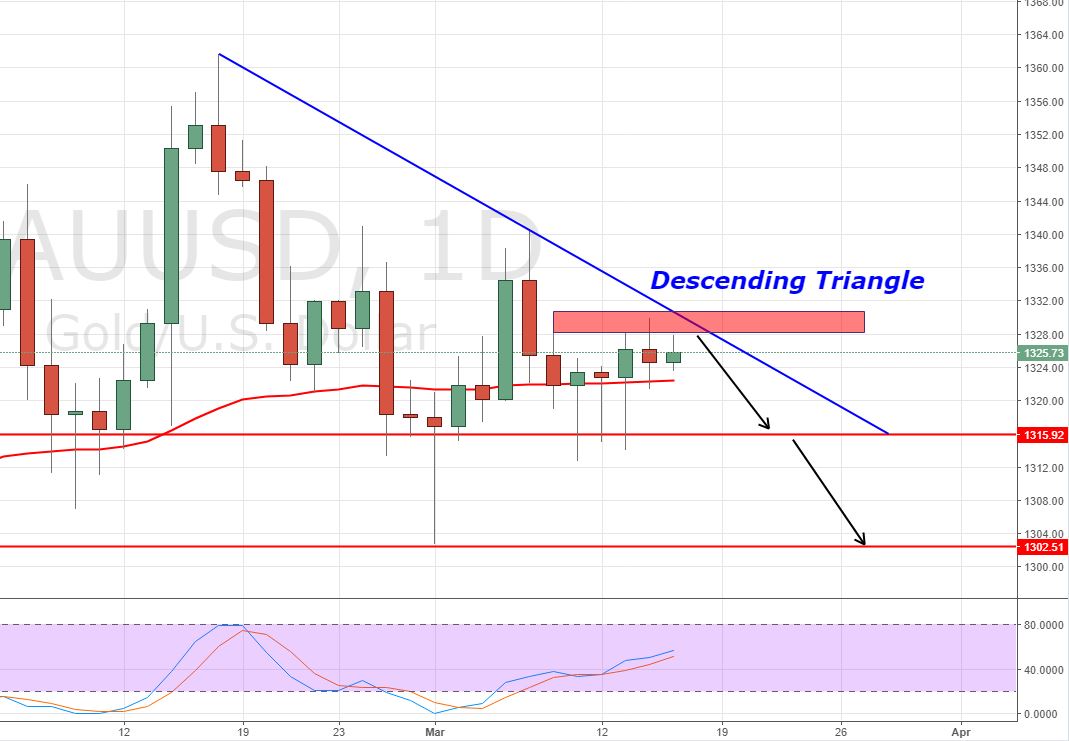
Gold – Daily Chart
Zooming out on the daily timeframe, you will find a descending triangle pattern supporting Gold near $1,315, whereas the bearish trendline is likely to extend resistance at 1,328.
For all the newbies, the descending triangles typically breakout downward. It means Gold has high chances to continue the bearish momentum but wait for the $1,315 breakout. As soon as the market breaks downwards, the yellow metal is likely to go after $1,302.
Support Resistance
1322.57 1329.29
1320.49 1331.37
1317.13 1334.73
Key Trading Level: 1325.93
Gold – XAU/USD – Trading Idea
Today, stay bearish below $1,326 with a stop above $1,329 and profit at $1,315 and $1,307.
Good luck!
- Check out our free forex signals
- Follow the top economic events on FX Leaders economic calendar
- Trade better, discover more Forex Trading Strategies
- Open a FREE Trading Account