Crude Oil Trades Sideways – Buckle Up for a Breakout Setup!
WTI Crude Oil is lollygagging in the narrow trading range before the release of API report today. Earlier, the Crude Oil prices were under pressure amid rising drilling activities in the United States, but not anymore. Here’s a quick trade plan…
WTI Crude Oil – Fundamental Review
The ongoing fears of a trade war between the United States and China, the world’s two biggest economies, are underpinning the crude oil.
As you know, there’s a negative correlation between US Dollar and the Crude Oil prices. The weaker dollar makes the Crude Oil cheaper for international consumers and they increase the demand for Oil which ultimately increases the prices of Oil.
In addition, the Crude gained support from OPEC members as Saudi Arabia and Russia restated goals to extend the output cut agreement.
WTI Crude Oil – Technical Outlook
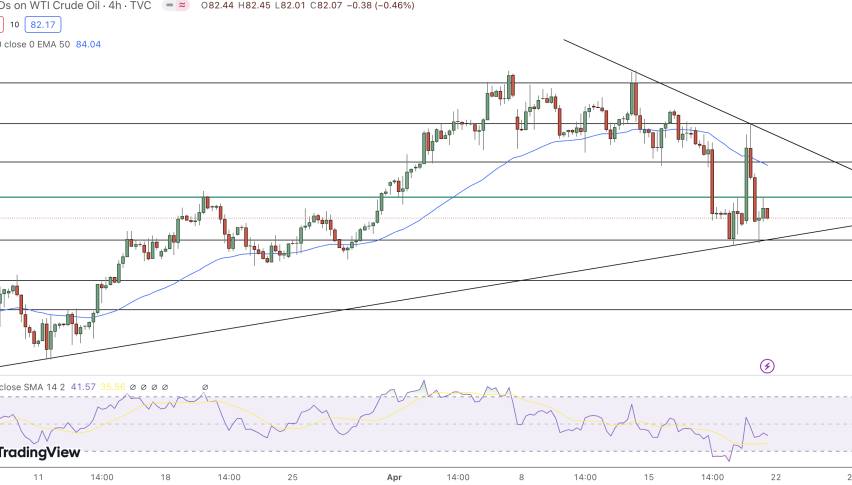
Looking at the 60 – Min chart, the Crude Oil is facing a solid support near $65.40. The number of Doji and Spinning Top candles are signifying the neutral sentiment of investors. It’s mostly because of the API report which is due to be released during the US session today.
WTI Crude Oil – Hourly Chart
WTI Crude Oil – Trading Plan
I will be looking to stay bullish above $65.40 with a stop below 65.20 and a take profit of $66.45. Good luck!


