The Most Important Indicator for Equities Right Now
Equity markets staged what was a strong turnaround on Monday.
Equity markets staged what was a strong turnaround on Monday. Markets were up around 2.5% in what was a change of pace after the bearish news of last week appeared to subside.
Late last week, equities felt the brunt of US President Trump’s trade wars, with China in the firing line.
That spooked investors and price pushed towards the recent lows that we made in February of this year. However, we ran into a big indicator that helped prop the market up.
200-SMA
I personally think the most important indicator in the world right now is the 200-SMA on the S&P 500.
This isn’t an indicator to trade as such, rather it is an indication of whether the market is bullish or bearish.
Equity markets or even stocks for that matter don’t just crash from their highs. They crash when they are already looking weak. And the best indicator of weakness is the 200-SMA.
Historically when prices have crashed, like during the GFC, we were already below the 200-SMA. This time around we haven’t closed below that level.
If you’re long equities, then you need to be watching the 200-SMA, because if we break below that point, we could be in for a big change in the direction of equity markets.
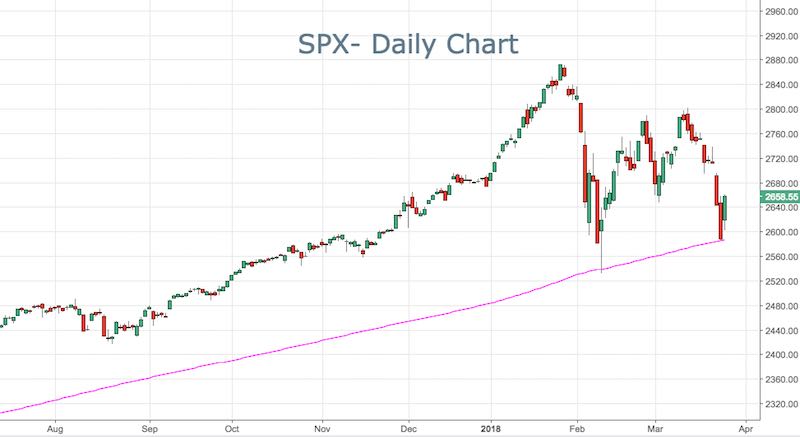
SPX – Daily Chart.
- Check out our free forex signals
- Follow the top economic events on FX Leaders economic calendar
- Trade better, discover more Forex Trading Strategies
- Open a FREE Trading Account