Key Support Levels in the EUR/USD
The story of trade continues to be the path of the USD.

The story of trade continues to be the path of the USD. A strong GDP print out of the US set the stage for a rally in the USD. That meant the majors felt some of the heat.
The EUR/USD was one of the bigger movers on the day and it cracked through a few major levels.
Some of the key technicals that got hit were the 100 and 200-day moving averages. Historically important indicators when it comes to overall market direction. It is also an indication that we haven’t really had a clear trend in EUR/USD for some time.
As you can see on the charts we’ve been range-bound for a number of weeks, making for tricky trading conditions.
Key Support Levels
There are a couple of pretty big support levels in the EUR/USD that have been holding up all year.
Clearly, they are 1.2250 and 1.2200. The chart actually looks really good if you’re looking to trade these ranges.
The way I would be looking to trade this on Thursday would be to aim for a test of 1.2250. Given the upside in the USD that we saw on Wednesday, there is a chance of some follow through. So I think a good exit point would be our first support level.
Of course, we’ll need to see some more upside in the DXY, which may or may not occur.
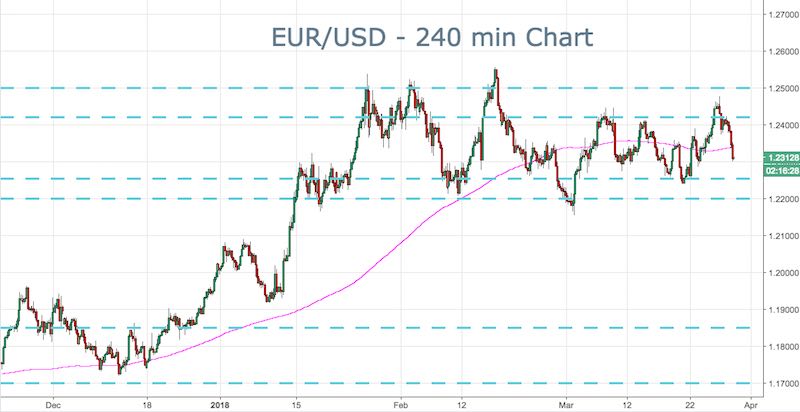
EUR/USD – 240 min Chart.
- Check out our free forex signals
- Follow the top economic events on FX Leaders economic calendar
- Trade better, discover more Forex Trading Strategies
- Open a FREE Trading Account