Equities Taking a Bullish Turn – A Technical Analysis of S&P500!
SPX has already completed 38.2% retracement at $2,627. On the breakage below $2,627, SPX can drop to $2,615 and $2,601...
Yesterday, the US indices took a bullish turn despite the ongoing trade war sentiments. Most of the bullish trend came in response the positive ADP as investors are expecting the same from NFP today.
Quick Technical & Fundamentals Review
At the moment, the investors seem to ignore the recent remarks from the US President Donald Trump. He directed his administration to consider tariffs on further $100 billion in Chinese imports. The recent drop in SPX was initiated after the news, however, the retracement was technically needed to encourage more bulls.
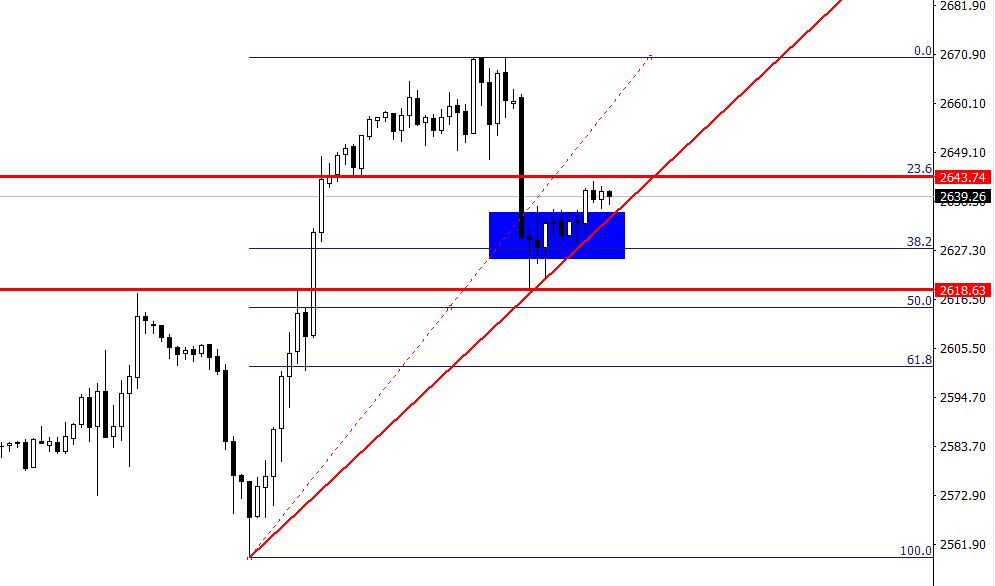
SPX – Hourly Chart
SPX has already completed 38.2% retracement at $2,627. On the breakage below $2,627, SPX can drop to $2,615 and $2,601. Whereas, on the upper side, SPX can face an immediate resistance near $2,644 and $2,668.
SPX – S&P500- Trade Idea
Today, the $2,622 is a very crucial trading level for SPX. Above this, the index can stay bulls until $2,652 and $2,670. Whereas, taking a sell position below $2,620 seems to be a good idea. If you are looking to trade the SPX, make sure to monitor the US labor market figures as it’s the only event which will drive volatility in the market today. All the best!
- Check out our free forex signals
- Follow the top economic events on FX Leaders economic calendar
- Trade better, discover more Forex Trading Strategies
- Open a FREE Trading Account