SPX & DAX Stable – Traders Cautious On Geopolitical Tensions
The global stock markets are quiet, but the ongoing tensions between the US, Russia, and Syria are keeping investors away from the market...
The global stock markets are quiet, but the ongoing tensions between the US, Russia, and Syria are keeping investors away from the market. Let’s take a look at the technical outlook of S&P500 and German30…
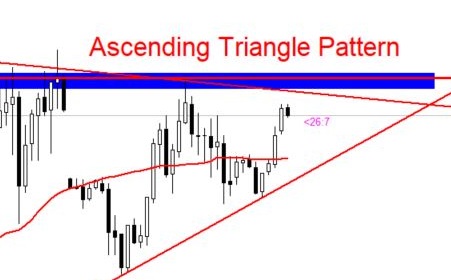
SPX – S&P500 – Ascending Triangle Pattern
You can see an ascending triangle pattern on the hourly chart. The pattern is providing solid resistance at $2,662 along with a support near $2,640. The ascending triangle pattern typically breaks out on the upper side. If this happens, we may see SPX soaring towards $2,672 and $2,680.
S&P500 – 2 – Hour Chart
Support Resistance
2641.37 2664.03
2634.36 2671.04
2623.03 2682.37
Key Trading Level: 2652.7
DAX – German30 – Descending Triangle Breakout
On the flipside, the DAX has broken out of the descending triangle pattern to trade at $12,350. You can also notice a 50-period EMA bullish crossover on the hourly timeframe.
German30 – Hourly Chart
Support Resistance
12262.97 12358.43
12233.49 12387.91
12185.76 12435.64
Key Trading Level: 12310.7
You can see a descending triangle breakout on the hourly chart. Technically, the DAX needs to come down towards 12310 to complete a retracement before it continues another bullish wave. I will be looking for bullish entry near 12310. Since both of the setups are based on triangle patterns, I would highly recommend all the newbies to study FX Leaders Triangles and Wedges – Forex Trading Strategies to take profitable positions.
- Check out our free forex signals
- Follow the top economic events on FX Leaders economic calendar
- Trade better, discover more Forex Trading Strategies
- Open a FREE Trading Account