Choppy Trading In Gold – Buckle up for a Breakout
Today, gold is trading sideways as the dollar breached three-month highs on easing concerns over North Korea. In the absence of any...
Today, gold is trading sideways as the dollar breached three-month highs on easing concerns over North Korea. In the absence of any economic catalyst, investors will be looking to trade the market technically. Check out the trade plan…
Gold – XAU/USD – Technical View
Gold took more hits as higher bond yields from other major economies are placing downward pressure on the safe-haven assets – and gold is one of them.
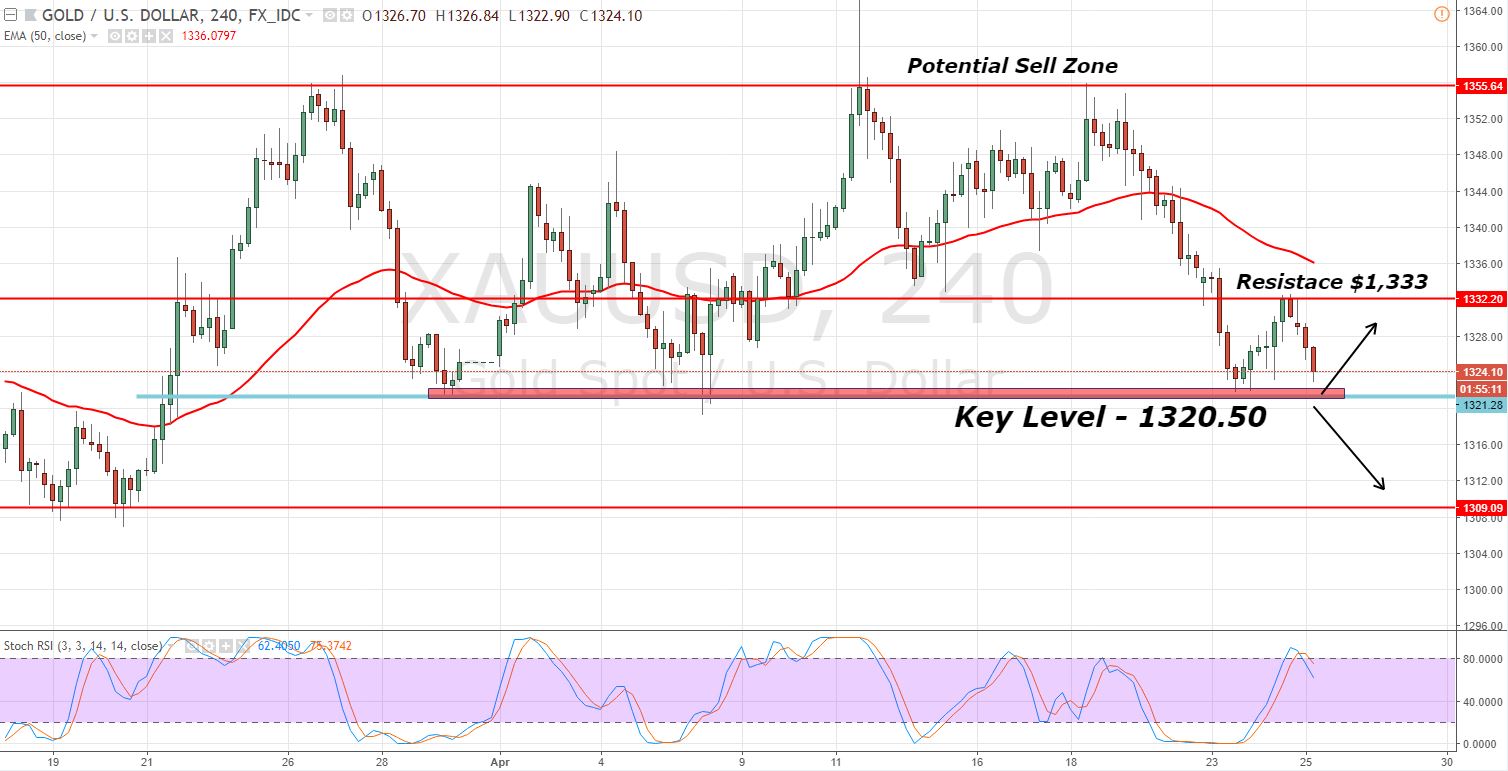
Gold – 240 – Min Chart
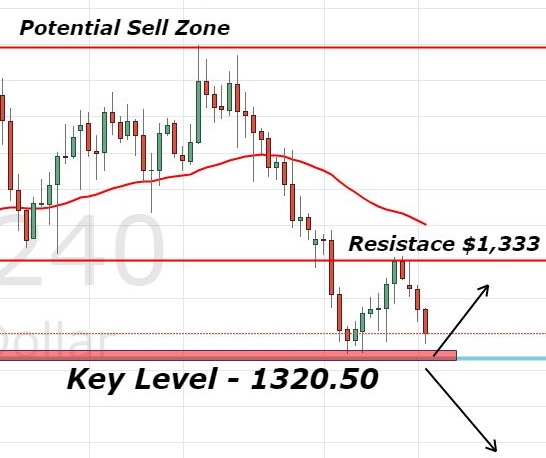
At the moment, gold is trading sideways in a tight trading range of $1,321 – $1,329. Looking at the 4-hour chart, gold is trading below the 50-period EMA (exponential moving average). The price is below this EMA, which signifies a bearish trend. The thing is, if the trend is bearish, we should also look for a bearish entry. Makes sense, right? Well, in this scenario, we should wait for a breakout.
With a breach of $1,320, gold could drop to $1,309. However, above $1,321 we could see a pullback. So, we can say that $1.320/21 is a crucial trading level for today.
Support Resistance
1326.31 1334.63
1323.73 1337.21
1319.57 1341.37
Key Trading Level: 1330.47
Gold – XAU/USD – Trading Plan
I will be looking to go long above $1,320 if the market continues to close the hourly candles above it. If $1,320 is breached, the cut and reverse strategy is my plan B. Good luck!
- Check out our free forex signals
- Follow the top economic events on FX Leaders economic calendar
- Trade better, discover more Forex Trading Strategies
- Open a FREE Trading Account