WTI Crude Oil Trading Sideway – Bearish Butterfly Plays
The market is waiting for the API report which is due in the New York session. Brace yourself for a quick move...
Crude oil is stuck in a narrow trading range of $67 – $69. Crude oil is fundamentally bullish but the stronger dollar is keeping it on hold. For now, the market is waiting for the API report which is due during the New York session. Brace yourself for a quick move…
WTI Crude Oil – Technical View
On the daily chart, we can see a bullish triangle pattern which is supporting crude oil near $68 along with a resistance up at $69.40. For the moment, crude oil is trading below $68 as the price has already moved near the horizontal resistance level of $68.10. Is it going to break upward?
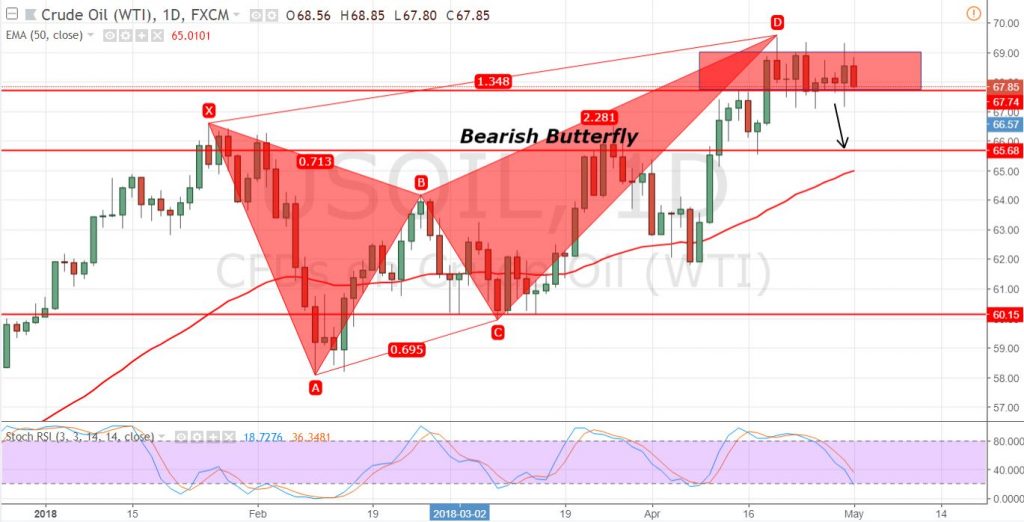
Well, the candlestick pattern “three black crows ” are signaling bearish bias of traders. Whereas, the momentum indicators, RSI and Stochastic are trading heading towards the oversold zone. By the way, don’t forget to see API stockpile report which is due to come out at 20:30 (GMT).
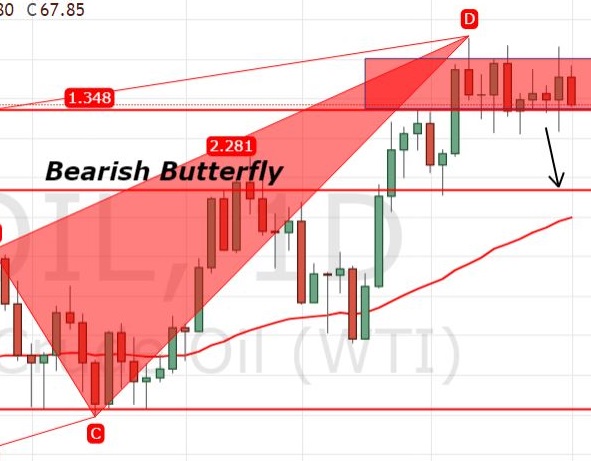
We can’t ignore the bearish butterfly pattern which has completed it’s C to D wave near $69. Hence keeping crude oil bearish.
WTI Crude Oil – Trade Idea
It will be nice to stay bearish below $68.35 to target $67.45 and $67.20 along with a stop loss above $68.65. Good luck!
- Check out our free forex signals
- Follow the top economic events on FX Leaders economic calendar
- Trade better, discover more Forex Trading Strategies
- Open a FREE Trading Account
- Read our latest reviews on: Avatrade, Exness, HFM and XM
Related Articles


Sidebar rates
Related Posts
