Crude Oil Dips Below 100 SMA – 61.8% Retracement on the Cards
It's all about the trade war between China and the U.S. Recalling the G7 meeting, Trump gave a head up of another round of tariff on...
It’s all about the trade war between China and the US. Recalling the G7 meeting, Trump gave a heads up about another round of tariffs on Canada, along with hefty tariffs on $50 billion woth of Chinese imports, starting on July 6. Whereas, China responded that it would repay by putting duties on several American commodities, including oil. This move caused a drop in U.S. stock markets, but supported the crude oil prices.
WTI Crude Oil – Technical Outlook
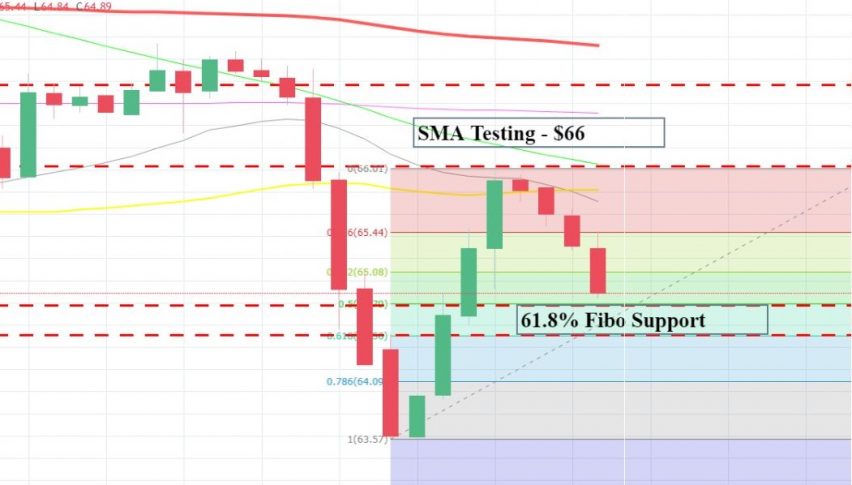
For the reason discussed above, crude oil soared to $66 to test 100 periods SMA on the 4-hour chart. The trading area of $66-$66.30 is a very solid resistance zone as you can see, but despite the strong fundamentals, crude wasn’t able to break through.
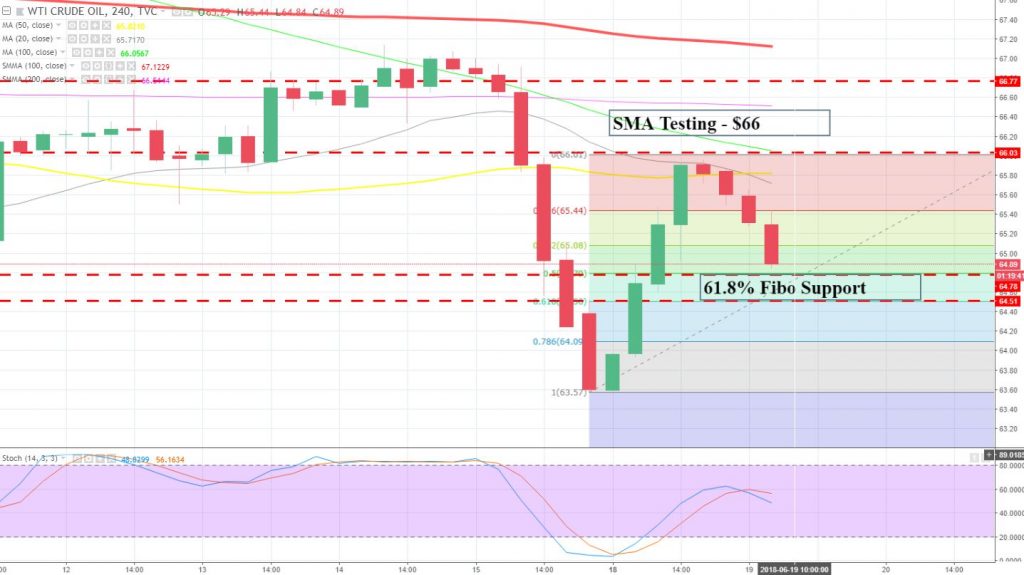
WTI Crude Oil – 4 Hour Chart
For the moment, crude oil is heading south to complete 50% retracement at $64.75. Below this, oil can gain support near 61.8% at $64.50. That’s the point where I will be looking for a buying position.
In addition, don’t forget to monitor the API weekly crude oil report at 20:30 (GMT) as this may offer us a quick move to catch.
WTI Crude Oil – Trading Plan
I will be looking to stay bullish only above $64.85 with a stop below $64.50 to target $65.50. Good luck!
- Check out our free forex signals
- Follow the top economic events on FX Leaders economic calendar
- Trade better, discover more Forex Trading Strategies
- Open a FREE Trading Account


