Crude Oil Violates Ascending Triangle – Trump Lashes out at OPEC
On Monday, WTI crude oil fell as stocks from Saudi Arabia and Russia grew while economic growth fell in Asia amid an escalating trade...
On Monday, WTI crude oil fell as stocks from Saudi Arabia and Russia grew while economic growth fell in Asia amid an escalating trade conflict with the U.S. Iran, the third largest producer in OPEC, will authorize private firms to export crude oil. Looks like a counter strategy to cope up with the U.S. sanctions. This way, the crude oil supplies may not be disrupted.
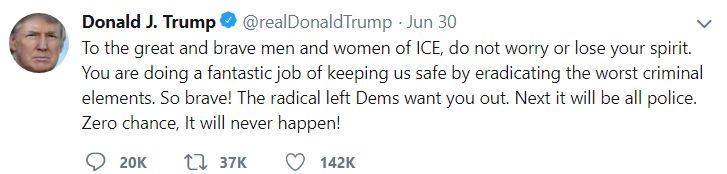
Trump stated in a tweet that Saudi Arabia’s King Salman bin Abdulaziz Al Saud had agreed to produce more oil.
WTI Crude Oil – Technical Outlook
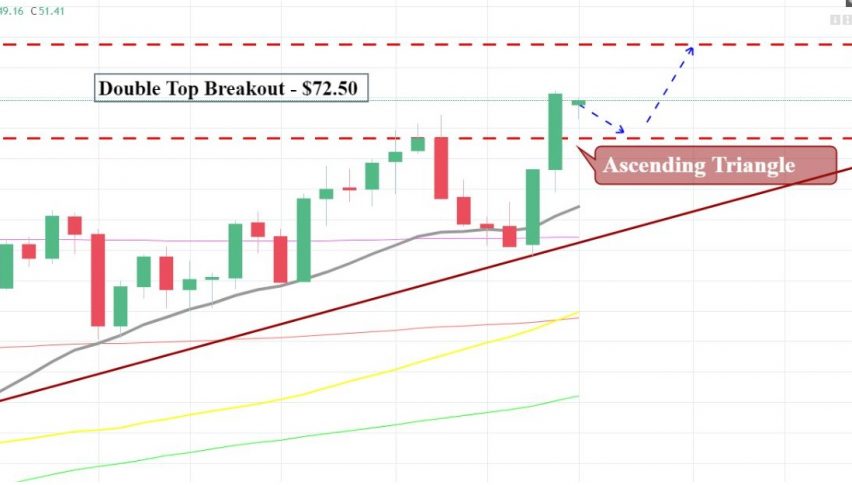
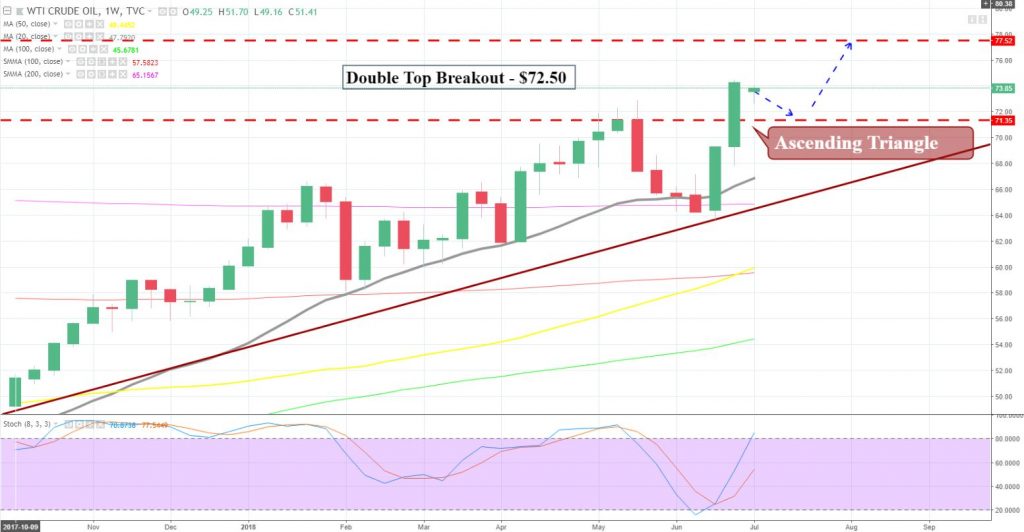
During the previous week, crude oil was trading right below a double top resistance level of $73. Back on April 22, the same level halted the bullish trend in crude oil as the markets were overbought. But this time, the market failed to sustain below $73 resistance level and broke out of it on Friday.
Crude Oil – Daily Chart
On the daily chart, oil is trading at $72.94 with an immediate support near $71.80. The intra-day resistance can be found at $73.64 and the violation of this level can give us further bullish trend until $75.70.
WTI Crude Oil – Trading Plan
Today $73 is a very crucial trading level and crude oil can stay bearish below this level to target $72.10 and $71.75. Good luck!
- Check out our free forex signals
- Follow the top economic events on FX Leaders economic calendar
- Trade better, discover more Forex Trading Strategies
- Open a FREE Trading Account