WTI Crude Oil – Ascending Triangle Breakout Plays Well
Crude oil prices gained a bullish momentum to trade over $70/ barrels, despite OPEC's decision to increase output by 1 million barrels...
Crude oil prices gained a bullish momentum to trade over $70/ barrels, despite OPEC’s decision to increase output by 1 million barrels. Anyway, the trade setup that we spotted on Monday is doing pretty well. Let’s look into it.
The President of the United States has asked all countries to stop importing Iranian oil from November, in order to ramp up pressure on Iran. That’s increasing the uncertainty in the global markets and, as the third largest producer of crude oil and supplies, Iran covers a significant demand in the market.
WTI Crude Oil – Technical Outlook
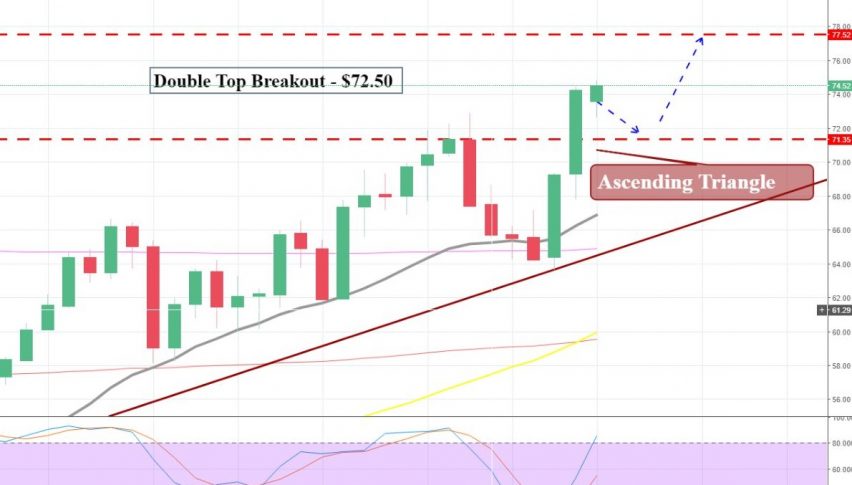
Last week, crude oil was trading right below a double top resistance level of $73. Back on April 22, the same level halted the bullish trend in crude oil as the markets were overbought. But this time, the market failed to stay below $73 resistance level and broke out of it on Friday.
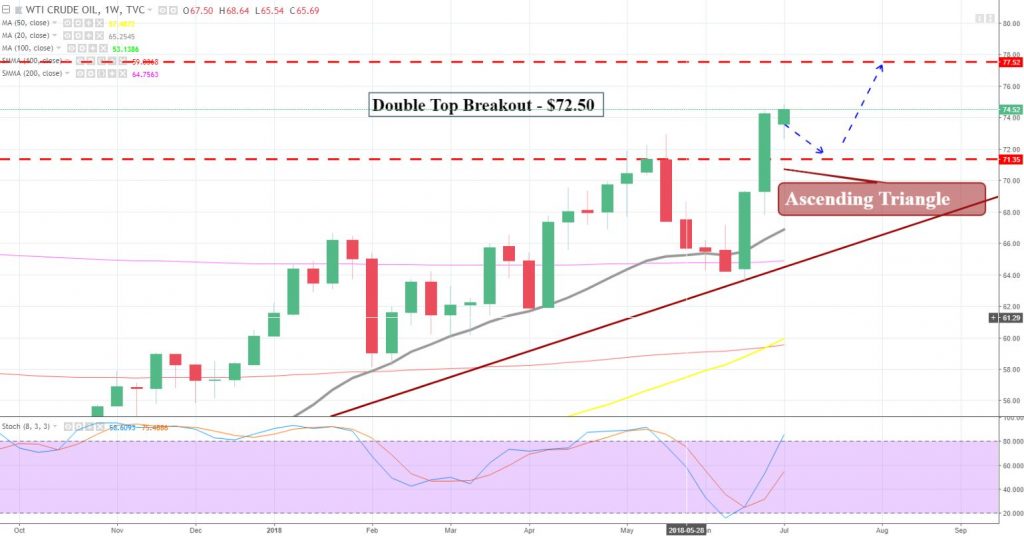
On the daily chart, oil is trading at $72.94 with an immediate support near $71.80. The intra-day resistance can be found at $73.64 and the violation of this level can give us further bullish trend until $75.70.
WTI Crude Oil – Trading Plan
Today $73 is a very crucial trading level and crude oil can stay bearish below this level to target $72.10 and $71.75. Good luck!
- Check out our free forex signals
- Follow the top economic events on FX Leaders economic calendar
- Trade better, discover more Forex Trading Strategies
- Open a FREE Trading Account


