Bearish Engulfing & EMA Pushing Gold Lower – $1,216 Next Target
On Tuesday, Gold prices plunged as the dollar steadied and U.S. Treasury yields rose on anticipation that the Federal Reserve would likely..

On Tuesday, Gold prices plunged as the dollar steadied and U.S. Treasury yields rose in anticipation of the Federal Reserve would likely continue hiking interest rates. However, investors seem to stay away from dollar after Trump’s criticism about the strengthening of the national currency. Today, we aren’t expecting any economic data from the U.S. economy. Therefore, the movement in gold is most likely to be technically driven.
3 Things to Know About Gold
1 – 100 Periods Moving Average
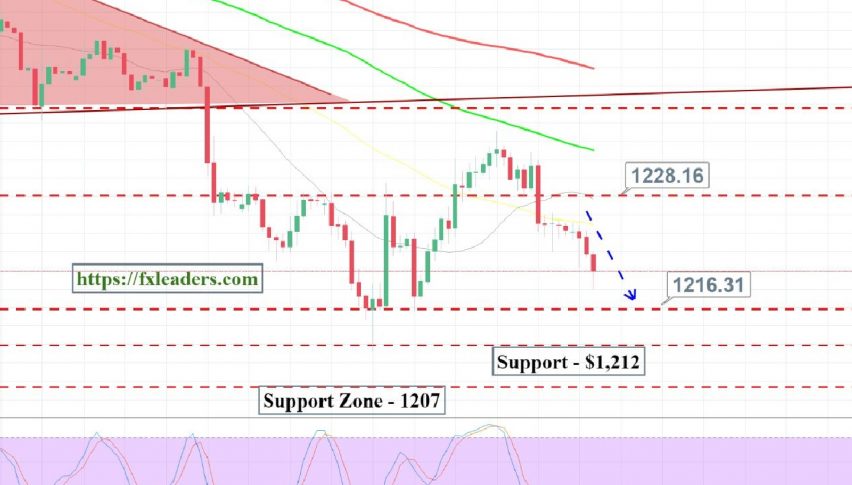
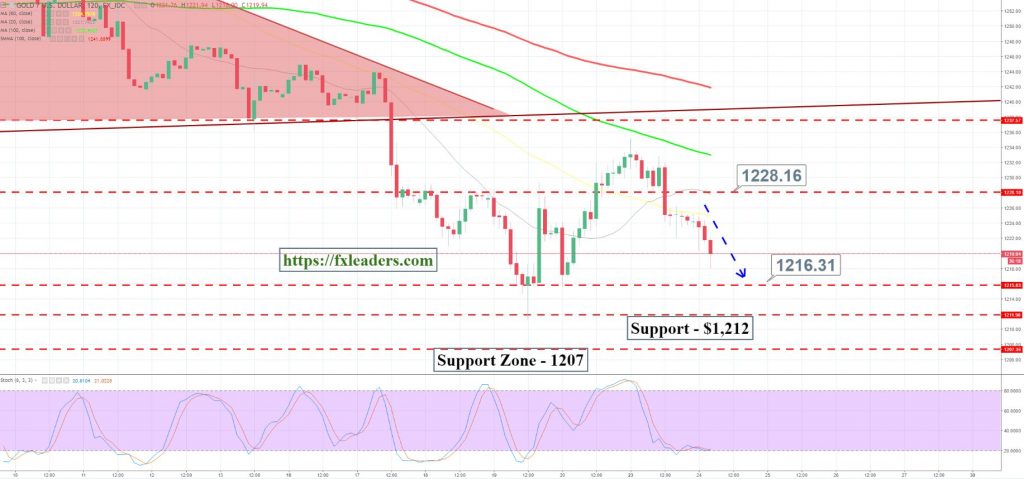
At first, I will draw your attention towards the 100 periods moving average which provided a solid resistance to gold near $1,232. It pushed gold lower despite the bullish breakout of triple top resistance near $1,228.
2 – Bearish Engulfing Pattern
We spoke about bearish engulfing candle yesterday, but the same pattern seems to keep gold bearish under $1,228. That’s where we closed our trading signal yesterday. It’s keeping the trading sentiment bearish for gold even today.
3 – What’s the next potential target?
In my opinion, the investors are likely to continue trading with bearish bias until the next target level of $1,216. On the 2 – hour chart, you can see a double bottom pattern which completes near $1,215.50. The violation of this pattern can drive more sellers until $1,212.

Gold – XAU/USD – Trading Plan
We opened a forex trading signal to stay bearish below $1,221 with a stop above $1,223 and take profit at $1,216. The signal is already in profit and being rational we should move our stop loss at a breakeven level. So let’s do it. Good luck!
- Check out our free forex signals
- Follow the top economic events on FX Leaders economic calendar
- Trade better, discover more Forex Trading Strategies
- Open a FREE Trading Account


