WTI Crude Oil Edged Higher – Triangle Pattern in Focus
The candlesticks pattern "three black crows" on the 2-hours chart, didn't do much for sellers. Fellas, the technicals aren't doing much...

The candlesticks pattern “three black crows” on the 2-hours chart, didn’t do much for sellers. Fellas, the technicals aren’t helping much today as the volatility remains thin. The bearish crude oil is trading steady in a narrow range of $67.40 – $68.40 as the scenario is somewhat jumbled now. Check out the key technical drivers of crude oil for today.
WTI Crude Oil – Technical View
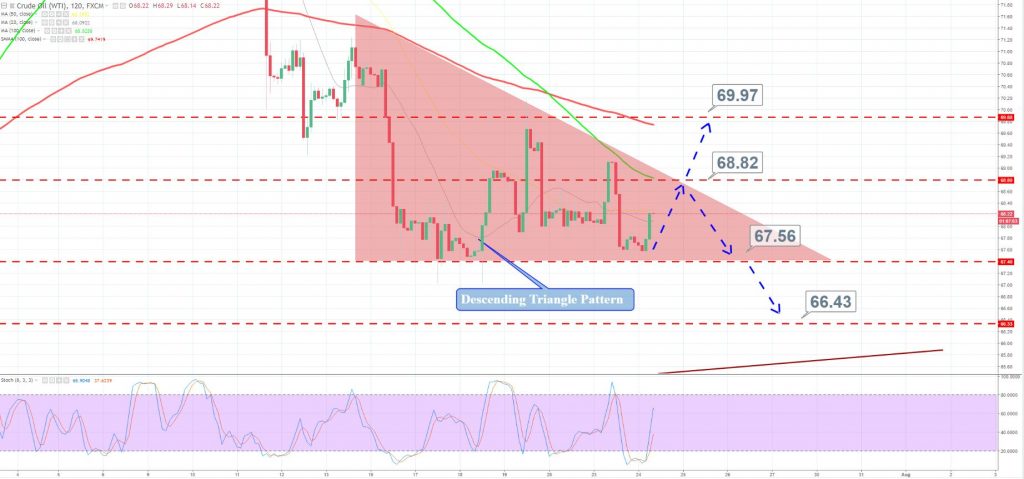
On the 2-hour chart, we can see a formation of a descending triangle pattern, which is supporting crude oil near $67.55 along with a resistance up at $68.80. For the moment, crude oil is trading at $68.20 and it looks like the bullish momentum will continue towards a horizontal resistance level of $68.80.
Is it going to break upward?
Well, technically it shouldn’t. Descending triangle patterns typically break downward. The crude prices are trading below 100 periods moving average which is another signal of bearish bias of traders.
The momentum indicators, RSI and Stochastic are trading in an overbought region. By the way, fellows don’t forget to see API stockpile report which is due to come out during the US session at 20:30 (GMT).
WTI Crude Oil – Trade Idea
Taking a buying position above 68 seems to be a good idea. The stop should be below $67.50 along with a take profit at $68.80 and $69.20. Good luck!
- Check out our free forex signals
- Follow the top economic events on FX Leaders economic calendar
- Trade better, discover more Forex Trading Strategies
- Open a FREE Trading Account
- Read our latest reviews on: Avatrade, Exness, HFM and XM
Related Articles


Sidebar rates
Related Posts
