Choppy Session In Gold – Trade War Tension Escalates
On Monday, gold begins trading in a bearish trend despite the trade war sentiments. During the weekend, the trade war sentiments heightene..

On Monday, gold began trading in a bearish trend despite the trade war sentiments. During the weekend, the trade war sentiments heightened on the comments made by POTUS (President of United States). Trump is considering increasing the tariffs from 10% to 25% on Chinese products.
On Sunday, Beijing announced that more than 5.2K American-made goods would be slapped with new taxes in reply to a threat by Donald Trump’s administration to inflict additional tariffs on $200bn of Chinese goods.
China has now inflicted tariffs on £85bn ($110bn) of the US goods. Last year, China imported nearly £100bn ($130bn) in goods from the United States. Despite all the uncertainties, the gold market is bearish as investors are more concerned about the two additional rate hikes in Sep and Dec 2018.
[fxml_m0re_topics]
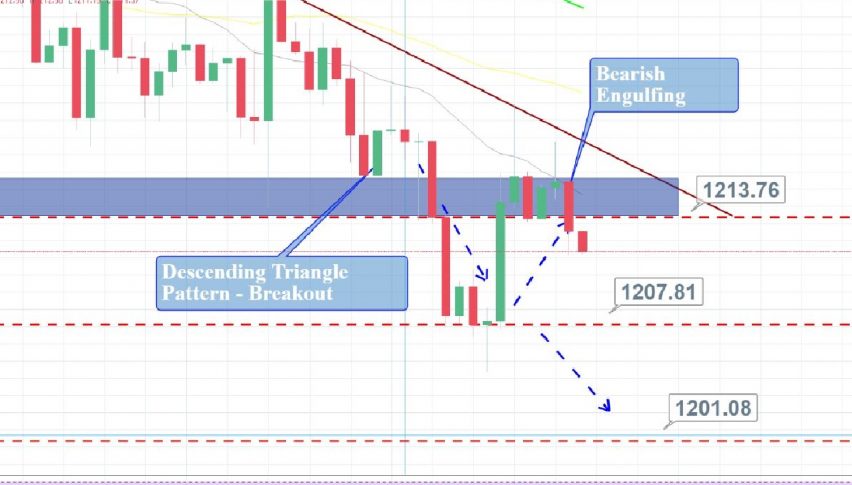
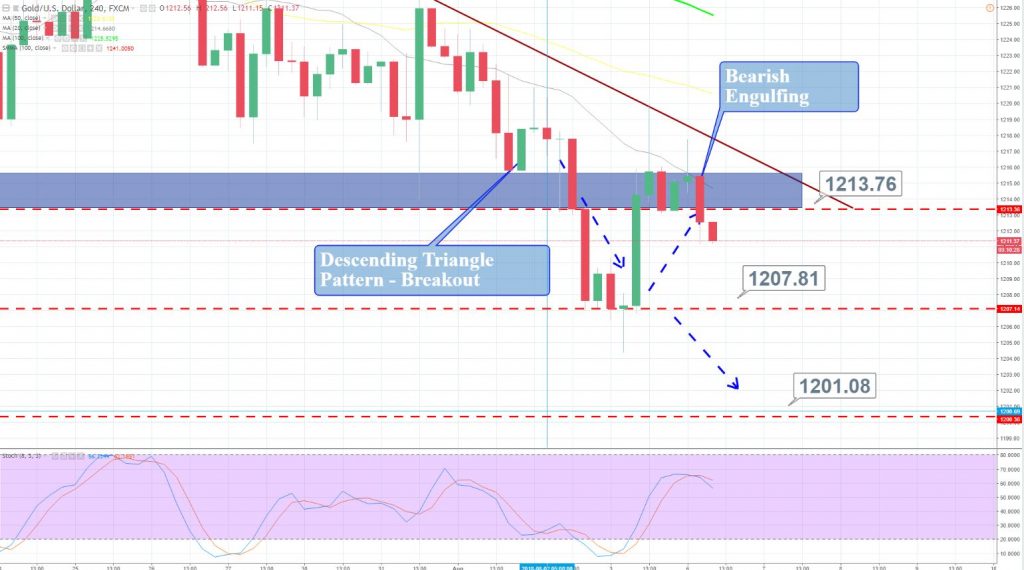
Technically, gold is facing a strong trendline resistance at $1,213 along with a support near $1,207. The 50 – periods EMA is also suggesting a bearish bias of investors.

The violation of $1,213 resistance on the upper side can lead gold prices towards $1,217. Whereas below $1,207, the market can stay bearish until $1,201.
Gold – XAU/USD – Trade Idea
As per our forex trading signal, we are in sell below $1,213 with a stop above $1,215 and take profit around $1,209. Good luck!
- Check out our free forex signals
- Follow the top economic events on FX Leaders economic calendar
- Trade better, discover more Forex Trading Strategies
- Open a FREE Trading Account


