Gold takes a bearish punch on chin – An update on Trading Signal!
Our earlier forecast on gold ‘Gold violates descending triangle pattern‘ did pretty well as the market gold prices plunged dramatically to hit our suggested level of $1,197. What’s next?
On Monday, gold prices fell below $1,200 to their lowest since late January 2017. Most of the selling trend was initiated on a strong dollar as investors tried to shelter from a financial market rout triggered by a crashing Turkish lira.
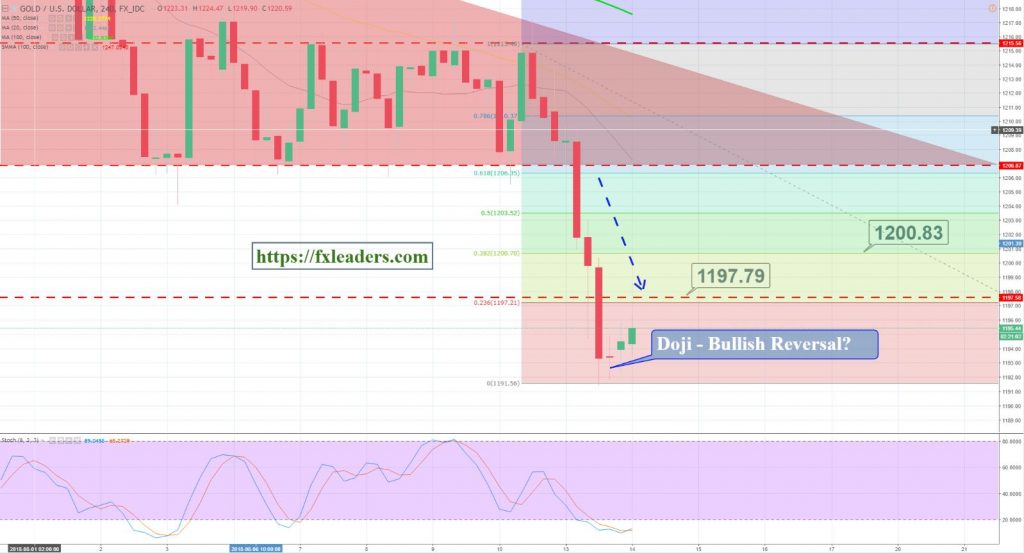
Earlier today, we shared a forex trading signal to open a buying position above $1,196 to target $1,199. The logic behind this trade is pretty simple. If you take a look on the 4-hour chart, gold has gone massively oversold after yesterday’s sell-off.

Gold – 4 Hour Chart
It has recently formed a Doji candle, which is representing a tug of war between bears and bulls. It means the bulls are likely to take over from here. Gold can go for retracement until $1,197 (23.6% Fibo level) and $1,200 (38.2%) level before taking another dip.
Good luck!


