

Crude oil stuck in sideways channel – Wait for breakout on EIA!


Crude oil slipped during the Asian session, pulled down by a report of rising US crude inventories. According to the API report, the US crude stocks rose by 3.7 million barrels in the week to Aug. 10, to 410.8 million barrels. Can we expect the same from EIA?
Well, we need to wait and watch as economists are expecting a drop of -2.6M inventories last week vs. -1.4M earlier. The data can keep the oil supported until the actual figures are out.
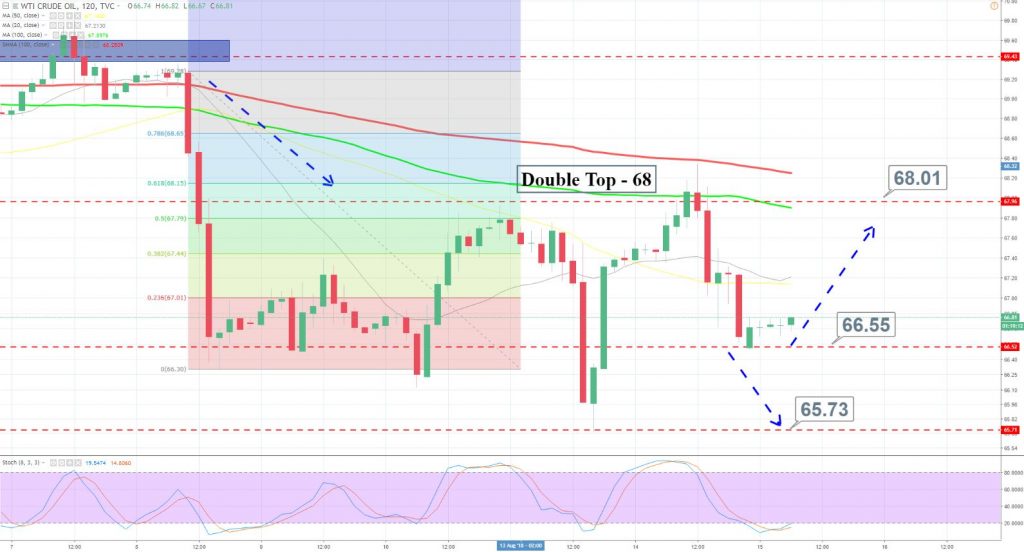
WTI Crude Oil – 4 Hour Chart
The immediate resistance is likely to be at $68.10 and $68.65. Whereas, the support prevails at $66.55 and $65.70. If you are interested in weekly trading levels, check out our recent update.
For today, taking buying positions only above $66.55 seems to be a good idea.
Check out our free forex signals
Follow the top economic events on FX Leaders economic calendar
Trade better, discover more Forex Trading Strategies
Related Articles


Comments
Subscribe
Login
0 Comments


