Bullish crossover in gold – Is it going for $1,216?
Gold continues to trade bullish at $1,211 on the weaker dollar concerns. As you know, gold shares a negative correlation with the greenback.
What’s up, traders.
Gold continues to trade bullish at $1,211 on weaker dollar concerns. As you know, gold shares a negative correlation with the Greenback, which the investors seem to move their funds into the safer assets and gold is the best option.
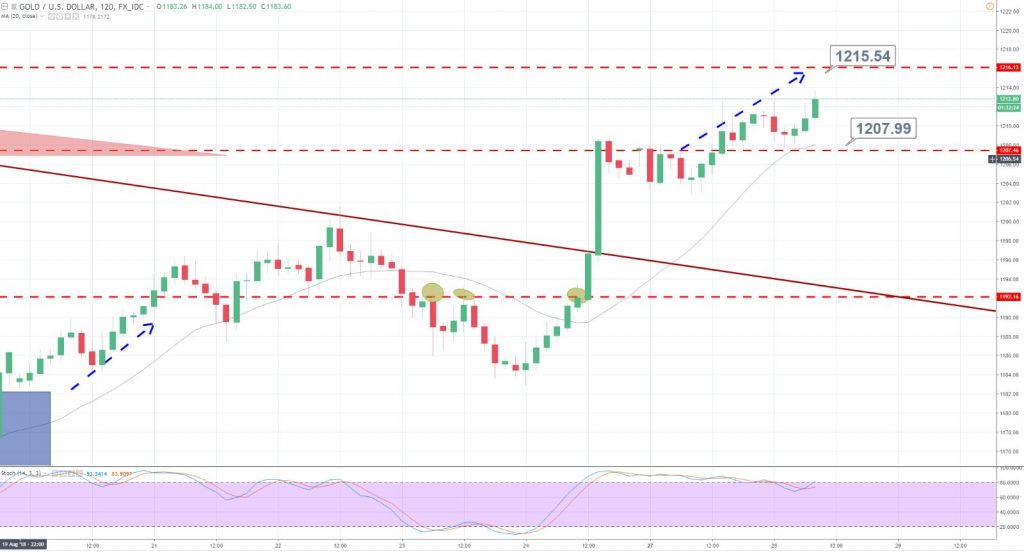
On the 2 hour chart, gold has already violated the strong resistance level of $1,207. Most importantly, gold has formed doji candles right above the resistance come support level of $1,207 which is clearly signaling the bullish intentions of investors. Whereas, the 20 periods of EMA is also supporting the buying trends.
Gold – XAU/USD – Trade Plan
Considering the technical outlook, we opened a forex trading signal to target $1,214.50 with a stop below $1,209. We don’t have much on the economic calendar but the technical levels will remain in play.
- Check out our free forex signals
- Follow the top economic events on FX Leaders economic calendar
- Trade better, discover more Forex Trading Strategies
- Open a FREE Trading Account
- Read our latest reviews on: Avatrade, Exness, HFM and XM
Related Articles


Sidebar rates
Related Posts
Ava

