Gold violates support – Is it after $1,190?
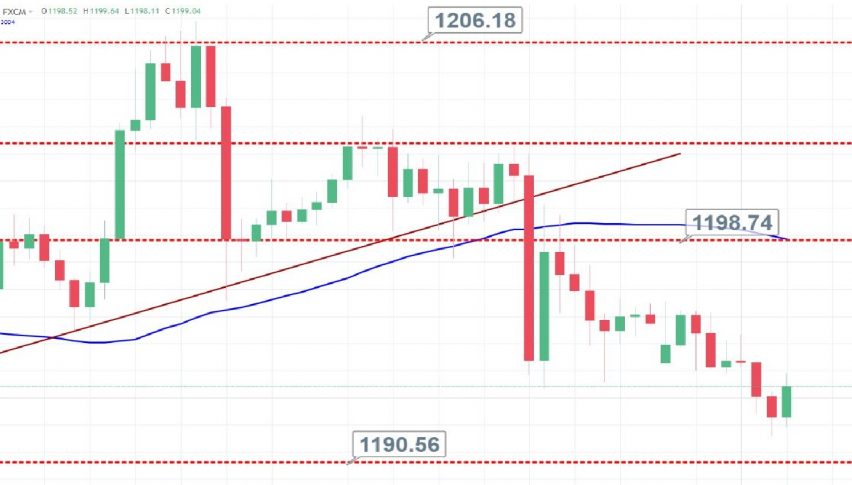
Taking a quick look on the hourly chart, gold has violated the intraday support level of $1,194 which can lead its prices towards $1,190.
•
Last updated: Monday, September 10, 2018
What’s up, traders.
Taking a quick look on the hourly chart, gold has violated the intraday support level of $1,194 which can lead its prices towards $1,190. In order to catch the move, we decided to jump in and share a sell trading signal below $1,194.50 to target $1,190.50.
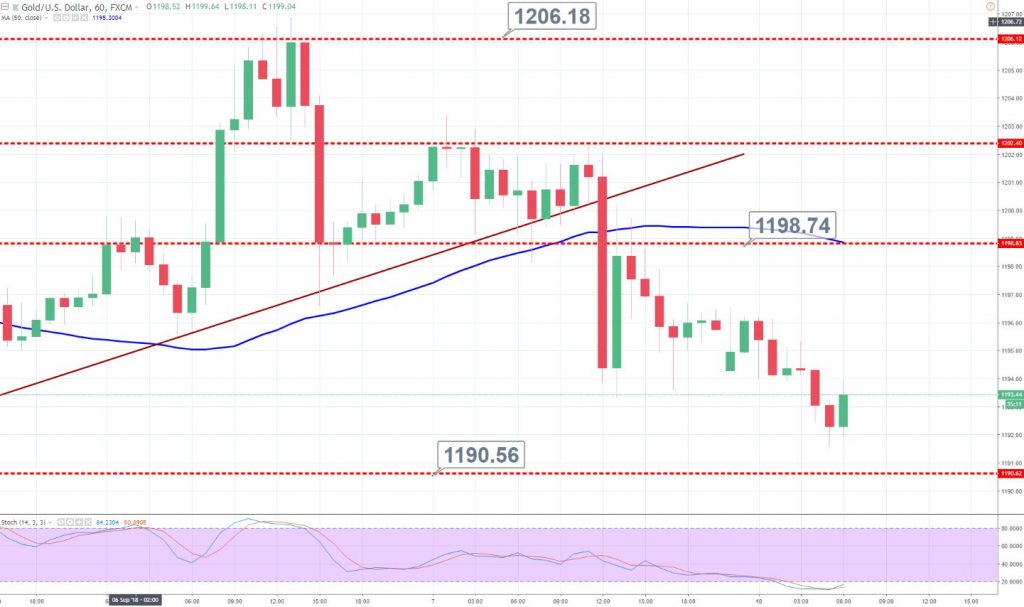
The RSI is supporting a selling trend along with the 50 – periods EMA. As you can see on the FX Leaders signal page, gold trade is making like 20 pips. Investors are advised to move their stops at breakeven points and keep following us for more updates!
- Check out our free forex signals
- Follow the top economic events on FX Leaders economic calendar
- Trade better, discover more Forex Trading Strategies
- Open a FREE Trading Account
ABOUT THE AUTHOR
See More
Arslan Butt
Lead Markets Analyst – Multi-Asset (FX, Commodities, Crypto)
Arslan Butt serves as the Lead Commodities and Indices Analyst, bringing a wealth of expertise to the field. With an MBA in Behavioral Finance and active progress towards a Ph.D., Arslan possesses a deep understanding of market dynamics.
His professional journey includes a significant role as a senior analyst at a leading brokerage firm, complementing his extensive experience as a market analyst and day trader. Adept in educating others, Arslan has a commendable track record as an instructor and public speaker.
His incisive analyses, particularly within the realms of cryptocurrency and forex markets, are showcased across esteemed financial publications such as ForexCrunch, InsideBitcoins, and EconomyWatch, solidifying his reputation in the financial community.