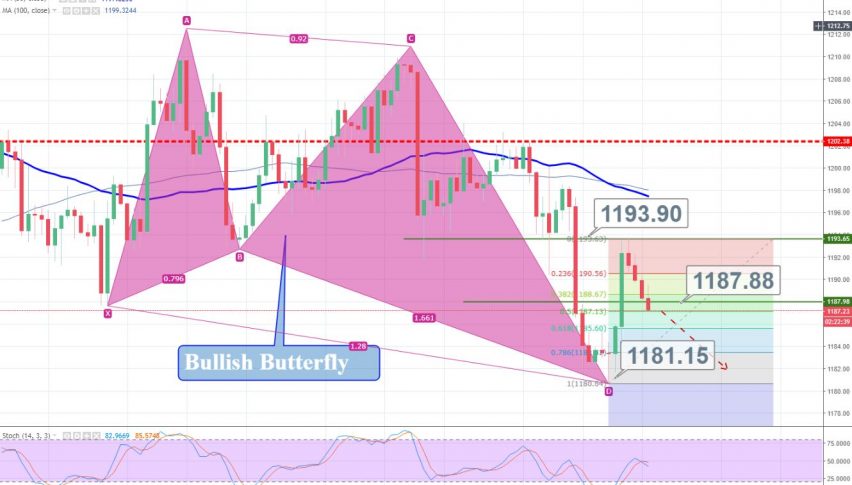
Gold Takes A Bullish Turn – Bullish Butterfly In Play
The precious metal gold remains under selling pressure after the Fed raised U.S. interest rates last week and said it planned four...
•
Last updated: Monday, October 1, 2018
The precious metal gold remains under selling pressure after the Fed raised US interest rates last week and said it planned four additional increases by the end of 2019 and another in 2020, amid steady economic growth and a strong job market.
As we know, higher US interest rates tend to boost the dollar and put pressure on gold prices by hiking an opportunity cost of holding non-yielding bullion.
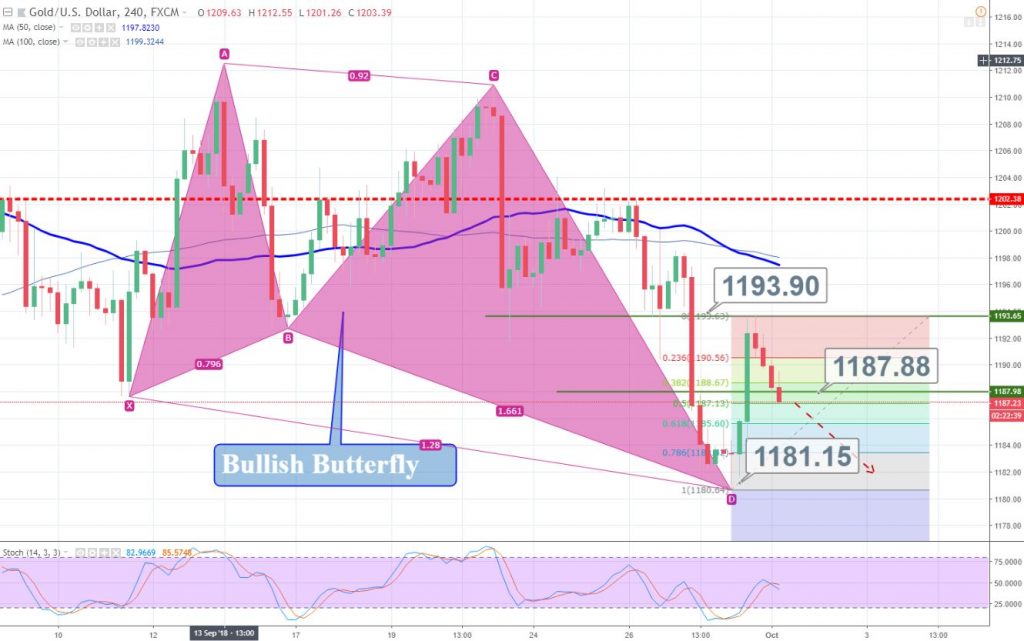
Gold – 4 Hour Chart
Technically speaking, gold has formed a bullish butterfly pattern on the 4- hour chat which has completed the C to D leg at $1,180 before taking a bullish retracement. I would love to go long on gold but the bullish butterfly isn’t complying with the 20 & 50 periods EMA. Both of the moving averages are suggesting selling bias for the precious metal.
The idea is to stay bearish below $1,189 with a stop below $1,192 and take profit at $1,185. Good luck!
- Check out our free forex signals
- Follow the top economic events on FX Leaders economic calendar
- Trade better, discover more Forex Trading Strategies
- Open a FREE Trading Account
- Read our latest reviews on: Avatrade, Exness, HFM and XM
ABOUT THE AUTHOR
See More
Arslan Butt
Lead Markets Analyst – Multi-Asset (FX, Commodities, Crypto)
Arslan Butt serves as the Lead Commodities and Indices Analyst, bringing a wealth of expertise to the field. With an MBA in Behavioral Finance and active progress towards a Ph.D., Arslan possesses a deep understanding of market dynamics.
His professional journey includes a significant role as a senior analyst at a leading brokerage firm, complementing his extensive experience as a market analyst and day trader. Adept in educating others, Arslan has a commendable track record as an instructor and public speaker.
His incisive analyses, particularly within the realms of cryptocurrency and forex markets, are showcased across esteemed financial publications such as ForexCrunch, InsideBitcoins, and EconomyWatch, solidifying his reputation in the financial community.
Related Articles

Sidebar rates
Related Posts
