Crude Oil Tests Bullish Trendline – Quick Trade Setup


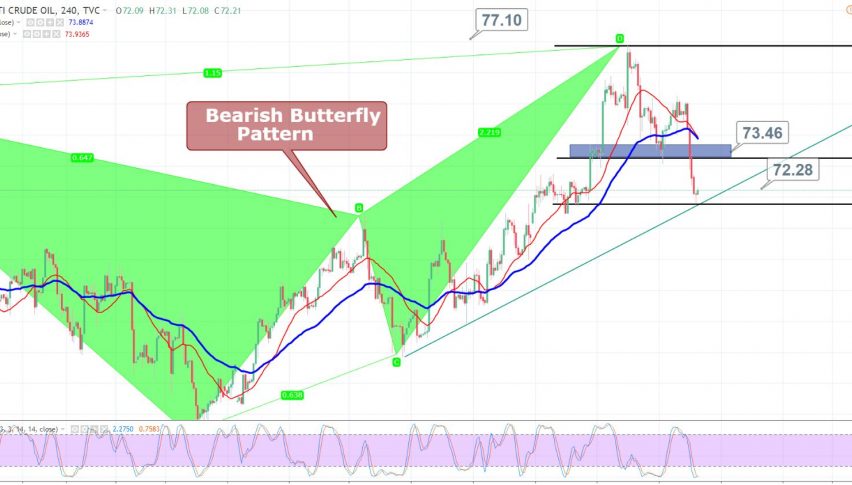
Recalling our earlier update, WTI Crude Oil Take a Dip – Bearish Butterfly Does Well, crude oil prices plunged to $71.78 level from the high of $76.88 within a week. All this came in response to the bearish butterfly pattern on the daily chart which was attracting sellers.
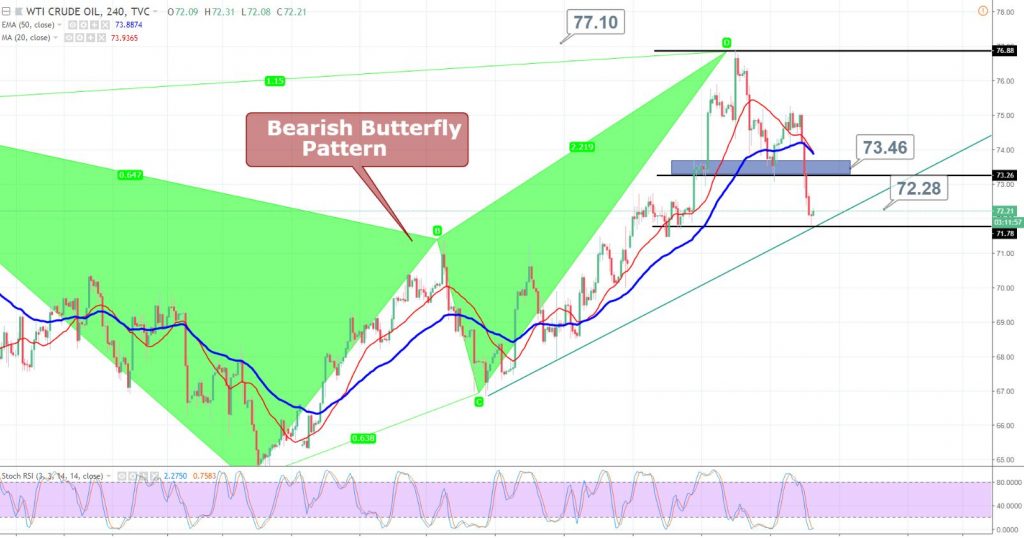
The pattern completed the C to D wave near $77.10. It violated the immediate support level of $72.75 on Wednesday to continue to bearish momentum. But the oil is testing a bullish trendline support near $71.78.
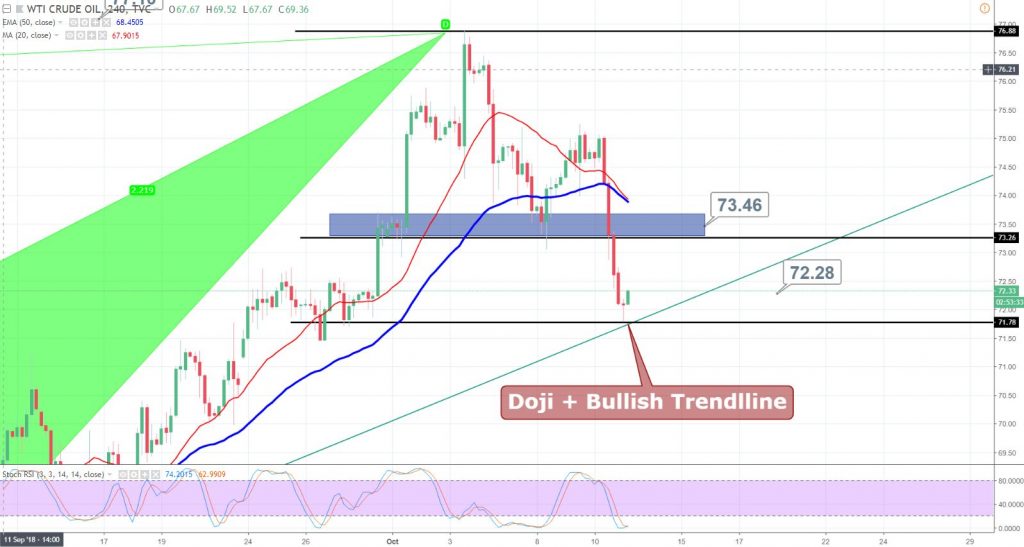
As you can see on the chart, the WTI crude oil has also closed a doji candle right above the major support level of $71.78, suggesting neutral sentiment of investors. I can be a good time to capture the retracement and that’s exactly what I’m trying to do now.
Support Resistance
71.57 74.25
70.59 75.95
67.91 78.63
Key Trading Level: 73.27
Our forex trading signal is to buy crude oil above $72 with a stop below $71.75 and a take profit at $73. Let’s see how it goes and we may probably close it before the release of EIA inventories report during the New York session.