Gold Testing Double Bottom – Is it Good Time to Jump in?
Gold is holding right above the strong support level of $1,216. The same level supported gold on Oct 18, which makes it a double bottom...

The precious metal GOLD eased on Wednesday, sliding off a more than the three-month peak during the New York session, urged by a strong dollar. Especially after the US Conference Board reported a consumer confidence of 137.9 vs. the forecast of 136.3. The unexpected jump in the US household sentiment says a lot about economic growth, which, as a result, is being reflected in the demand for dollar.
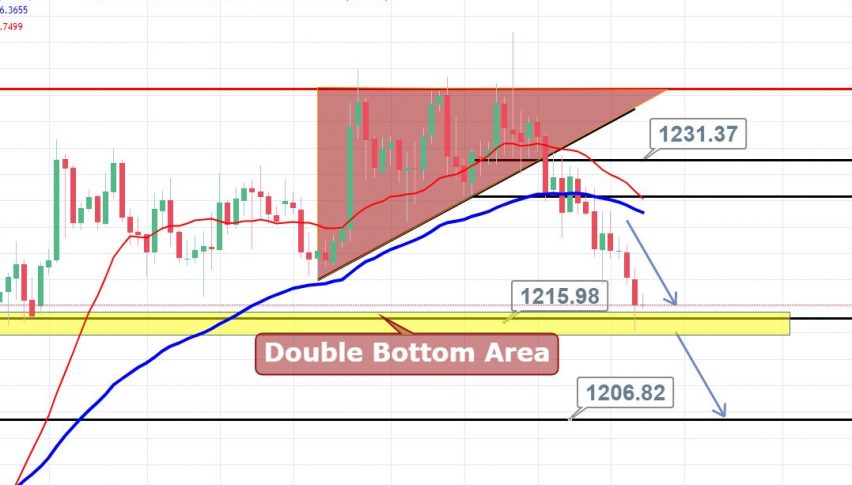
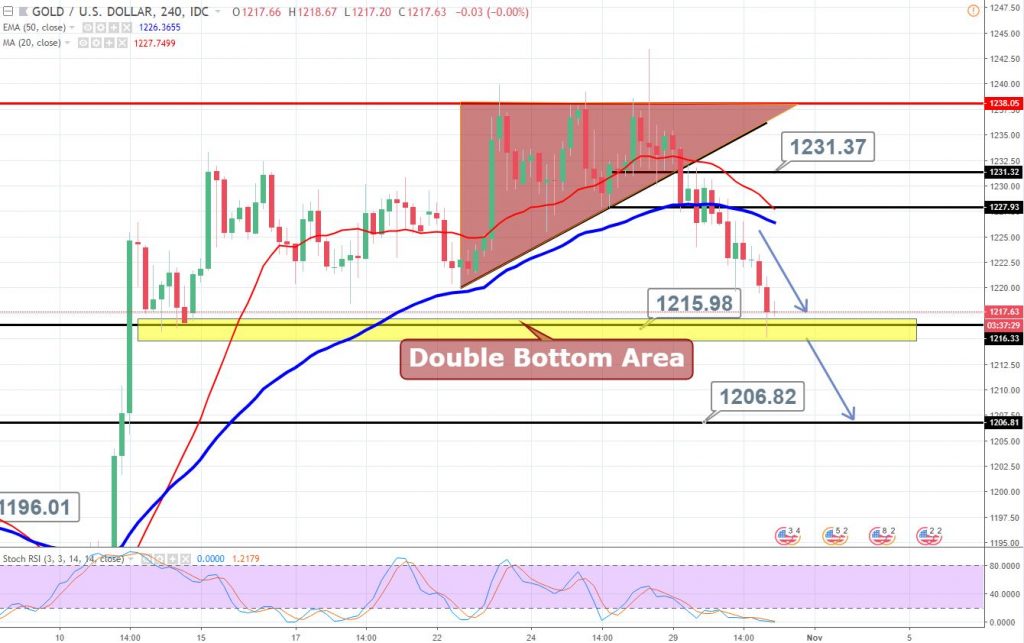
Looking at the technical side, gold is holding right above the strong support level of $1,216. The same level supported gold on October 18, which makes it a double bottom level.

Gold – 4 -Hour Chart
Zooming in on the 4-hour chart, the immediate candle is half bearish and half bullish, demonstrating that the buyers are looming around $1,216. The trend is clearly bearish, however, the market can show us a slight retracement until $1,220 to $1,223 before it continues its bearish trend.
Support Resistance
1218.98 1227.96
1214.97 1232.93
1205.99 1241.91
Key Trading Level: 1223.95
GOLD – XAU/USD – Trade Idea
Considering the technical indicators, we opened a buying position above $1,216 to catch a quick retracement until $1,220 with a stop below $1,213. On the flip side, selling is preferred below $1,223.
Good luck!
- Check out our free forex signals
- Follow the top economic events on FX Leaders economic calendar
- Trade better, discover more Forex Trading Strategies
- Open a FREE Trading Account


