Why Oil Prices Hit A 2018 Low & What’s Next? – WTI Collapse Explained
Happy Sunday, traders.
We made it through another week with nice profits from long-term trades in the USD/CAD. All thanks to crude oil, as the volatility in the crude oil prices drove massive fluctuations in Canadian dollar as well. WTI crude oil posted the seventh consecutive weekly loss, amid intensifying fears of a supply glut even as major producers consider cutting output.
On Friday, the WTI crude oil prices dived 7.7% to $50.42 a barrel, the biggest one-day decline in three years and the lowest level in more than a year. In fact, Brent crude oil futures also tumbled below $60 for the first time since October 2017. In this update, we are going to discuss the major reason behind a sharp sell-off and what to expect next…
Top Reasons Why Oil Prices Hit A 2018 Low
Here are a few reasons that added to Friday’s plunge, which had WTI crude oil shedding…
The US-China Trade War
One of the major reasons behind the sell-off is that the US-China trade war keeps the market uncertain. Trump is looking to hike the 10% tariff to 25% on $200 billion worth of Chinese products. It comes with a high probability of hurting the Chinese manufacturing sector.
Drop in manufacturing means less demand for crude oil. Since China is a top importer of crude oil, this sentiment threatens the crude oil bulls.
According to a Reuters report on Friday, China’s demand for oil byproducts and gasoline dropped to the lowest level in 13 months, which is another sign that the Beijing-Washington trade dispute is damaging the world’s second-largest economy and one of the biggest importers of energy-related goods.
Iran’s Sanctions & Bearish Reversal
In September, President Donald Trump’s continued bid to sanction Iranian crude exports could have also triggered a dramatic shortfall in global supply.
Back then, it was expected that the US sanctions on Iran’s energy industry, when they come into effect in November, could potentially drive WTI crude oil prices above $80 per barrel. That’s exactly how the market reacted. Investors started trading crude oil with bullish sentiments and drove oil prices to four years high of $76.88.
However, after driving the crude oil prices to a peak, Washington granted temporary waivers to eight countries, including China and India, the biggest purchasers of Iran’s oil.
Back in November, the US Secretary of State Mike Pompeo declared that as part of the reimposed sanctions, eight essential oil importers including China, India, South Korea, Turkey, Italy, Greece, Japan, and Taiwan, would get 180-day exemptions, permitting them to buy Iranian oil as long as they show cuts in volume.
The sanction waivers have further soothed concerns that the oil market will turn into a shortage of crude supplies. Expectations for weaker-than-anticipated global economic growth amid a continuing US-China trade conflict drive further concerns about demand for oil.
In response to this, all traders who held crude oil futures panicked and triggered a sell-off in crude oil, dragging oil prices down to $50 on November 23.
EIA Stockpile Reports – Connective Build
The US crude oil output has risen by almost 25% this year, to a record 11.7 million barrels per day (bpd), according to the Energy Information Administration. This is sparking concerns that supplies will destroy demand. Major producers Russia and Saudi Arabia are also seen producing at record levels.
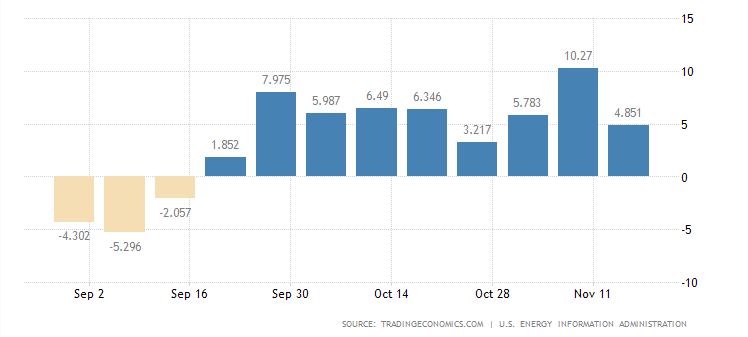
As you can see in the histogram below, the EIA has been reporting build in inventories since September 2018 which is showing nothing but a lack of demand in the market.
Stronger Dollar vs. Crude Oil – Negative Correlation
A string ties together the US dollar and crude oil as the oil prices are denominated in the US dollar. Tighter American monetary conditions are an unwelcome combination for energy importers in Asia.
The US Federal Reserve hiked the interest rate three times in 2018, making the US dollar skyrocketing. The stronger dollar makes crude oil expensive for the international trader, diminishing the demand for crude oil. Recalling law of demand, a drop in demand causes a drop in prices.
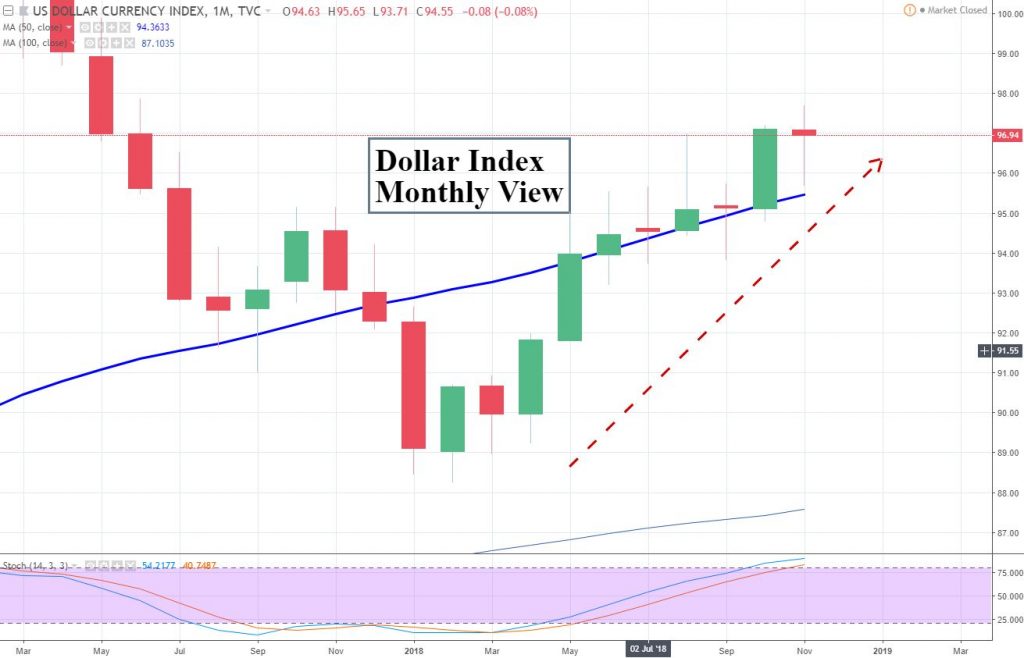
A rising dollar also helped to create a headwind for the commodity because the dollar-priced asset becomes less attractive to buyers using other currencies when the buck strengthens. As you can see in the chart, the dollar index is peaking at $97 while at the same time crude oil is placing a slow at $50.19.
WTI Crude Oil – Weekly Technical Outlook
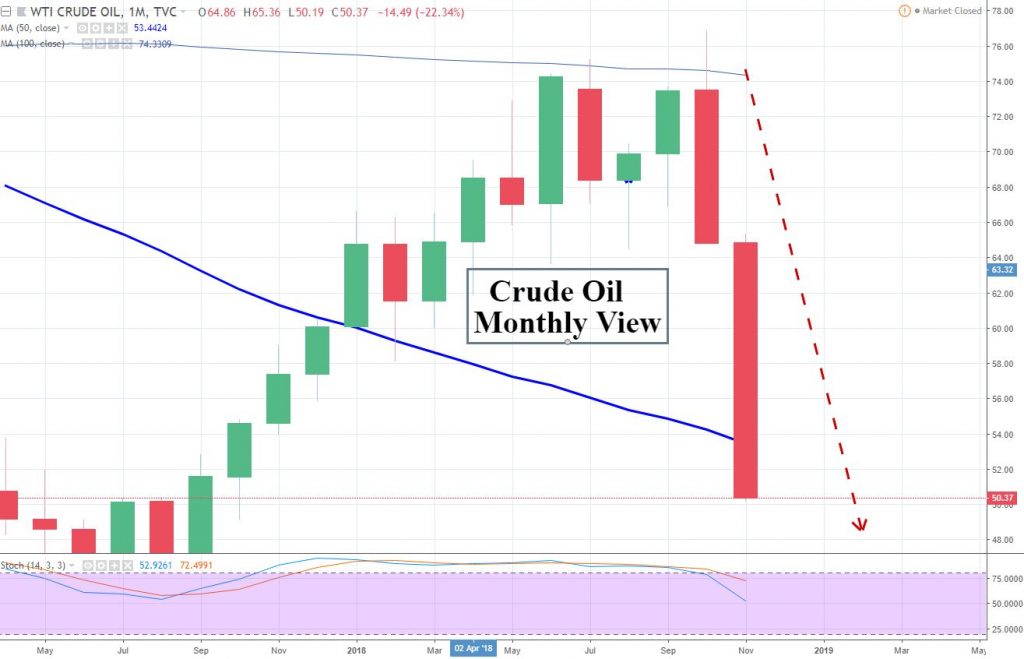
I’m afraid the technical side doesn’t seem to share good news for the crude oil buyers. The oil prices continue to fall dramatically, and this past week was horrific. Crude oil prices dived 7.7% to $50.42 a barrel, the biggest one-day decline in three years and the lowest level in more than a year.
Key Technical Points to Know
The black gold has entered an oversold zone which is indicating that the sellers may look for profit taking now.
The immediate support prevails at the psychological level of $50 and below this, oil can go after $47.50 and $43.50. This shows that we could be coming close to a supportive area, but you don’t want to be the first person to step into this market and try to pick it up.
Technical Levels – Swing Trading
Support Resistance
47.9 55.29
45.35 60.13
37.96 67.52
Key Trading Level: 52.74
For now, traders eye US-China tensions and will likely shift focus to the G20 leaders’ summit later this month in Argentina on Nov 30 – Dec 1. The US President Donald Trump is supposed to meet with his Chinese counterpart Xi Jinping to negotiate and, if both of them come to a lenient tariff policy, this is going to put the dollar under massive selling pressure.
Here we go, a weaker dollar and lenient tariff policy can help crude oil’s recovery. Until then, let’s wait & watch for the short term intra-day trades.
All the best and have a profitable week!


