Crude Oil Completes ABCD Pattern – Should We Sell?
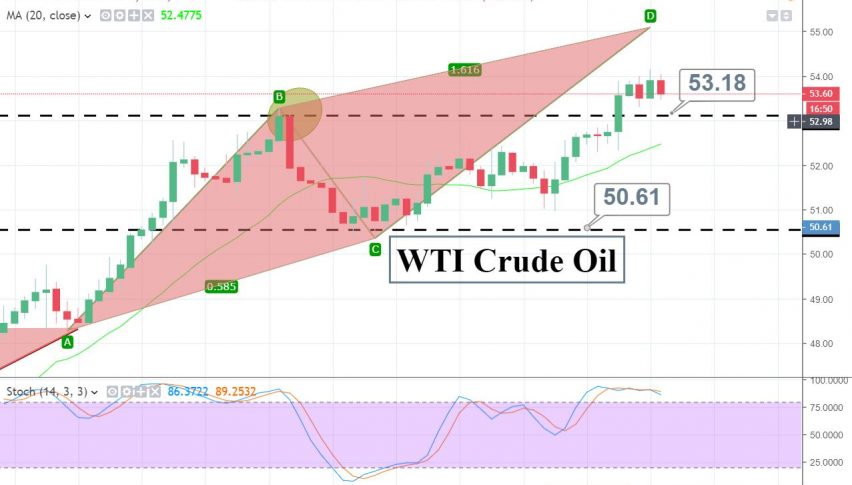
Crude oil has formed an ABCD pattern on the 4-hour chart. It's about to complete the C to D leg somewhere near $55.
On Monday, the WTI crude oil prices jumped to their highest so far in 2019. There are multiple fundamentals going on behind oil movement. Let’s look at them.
Lately, the refinery processing in China, the world’s second-largest oil user, climbed to a record last year. Thing is, oil is soaring despite a slowing global economy.
Support Resistance
53.01 54.55
52.03 55.12
50.49 56.66
Key Trading Level: 53.58
Crude Oil has formed an ABCD pattern on the 4-hour chart. It’s about to complete the C to D leg somewhere near $55. Typically, the bullish ABCD pattern leads to a bullish trend, therefore we would look for a buying position in crude oil.
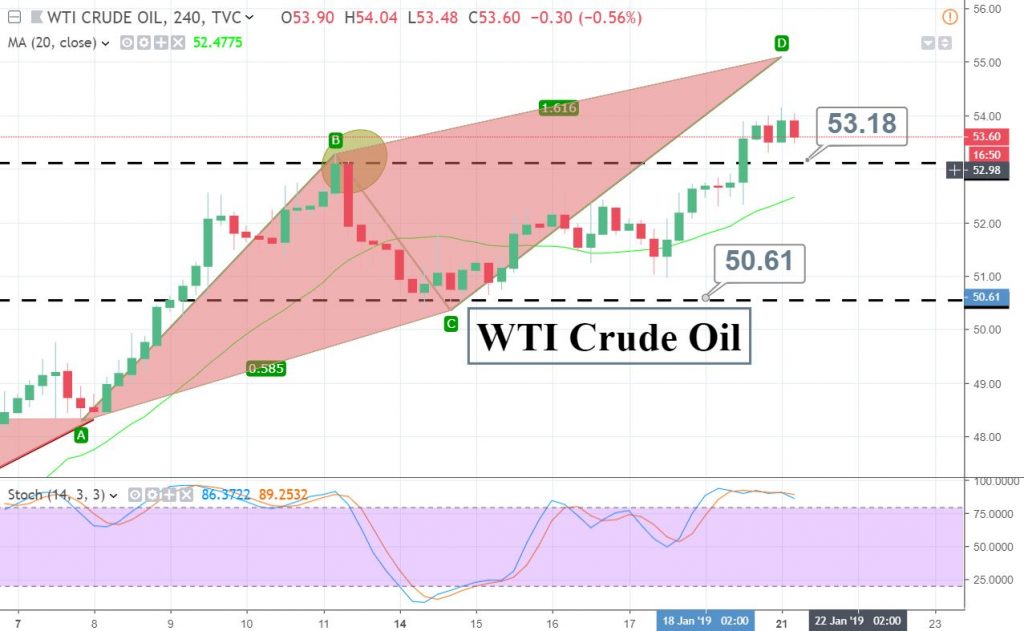
For now, we need to keep an eye on $53 as it’s providing solid support and that’s where I would like to place a buy. Whereas, it’s likely to face immediate resistance near $54.
Good luck!
- Check out our free forex signals
- Follow the top economic events on FX Leaders economic calendar
- Trade better, discover more Forex Trading Strategies
- Open a FREE Trading Account
- Read our latest reviews on: Avatrade, Exness, HFM and XM
Related Articles


Sidebar rates
Related Posts
