Weekly Crypto Roundup
This was a very calm week for the major cryptocurrencies and
This was a very calm week for the major cryptocurrencies and Bitcoin. Bitcoin and most of the cryptocurrencies are ranging between support and resistance and didn’t show too much volatility yet. However, there were a few coins which went parabolic. So, let’s dive right into the technical analysis of Bitcoin, Ethereum and the total market capitalization.
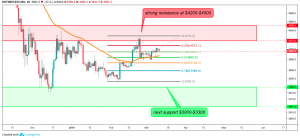
BTC/USD DAILY CHART

Bitcoin didn’t fall below the golden pocket at $3740 so far and is currently ranging between the 0.236 and 0.5 fib level. With the sideways movement, a big move in one of the two directions shouldn’t be too far away. The current outlook doesn’t give a clear bull or bear sign. Thus, it is advised to wait for confirmation.
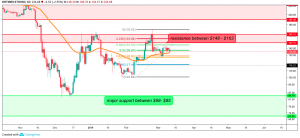
ETH/USD DAILY CHART

Although the recent bounce of the golden pocket zone is quite bullish, Ethereum didn’t manage to re-test the resistance at $148. Ethereum is currently ranging between the 0.382 fib level and the golden pocket and the 50-day-EMA acted as support so far.
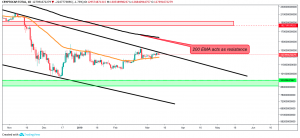
TOTAL MARKET CAP DAILY CHART

The total market capitalization of the cryptocurrencies market is ranging between the 50-day-EMA support and the channel resistance. The setup is quite neutral; however, if the channel resistance is broken, the next resistance will be found at the 200-day-ema, around $160b. If the overall market capitalization value drops below the 50-day-EMA, it will most likely find its next support around $93b.
Parabolic gainers of this week were:
RVN, which surged by 326 percent since its low on February 5, and 84 percent last week alone,
ENJI, which rose by 1020 percent since its low on February 6, and 250 percent during the last week,
and COSM, which gained 230 percent by last week.
Among some positive news of last week were Cryptopia giving back its users access to their wallets, Swissquote Bank declaring to launch crypto custody and Starbucks announcing to support BAKKT, the upcoming platform for digital asset trading.
- Check out our free forex signals
- Follow the top economic events on FX Leaders economic calendar
- Trade better, discover more Forex Trading Strategies
- Open a FREE Trading Account