Weekly Crypto Roundup
The cryptocurrencies market doesn't know where to go right now.

The cryptocurrencies market doesn’t know where to go right now. While there are plenty of altcoins blowing off right now, Bitcoin is not showing clear signals for a bull trend. In fact, Bitcoin seems to stick to its sideways path. So without further ado, let’s jump right into the technical analysis of Bitcoin, Ethereum and the total market capitalization before we look at the most interesting news of this week.
BTC/USD WEEKLY CHART
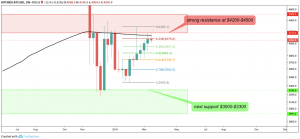
Although Bitcoin had five green weekly candles during the last eight weeks, Bitcoin failed to break the 200-week-EMA and was therefore bearishly rejected. Bitcoin needs to break the 200-week-EMA resistance and the $4200-$4500 resistance in order to confirm a bullish trend switch. The bigger market cycle is still bearish and Bitcoin sticks most likely to its bear path if there is no significant increase in volume.
BTC/USD DAILY CHART
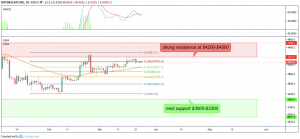 The 50-day-EMA acted successfully as support so far. Interestingly enough, the 50-EMA is exactly where the 0.382 fib level is. Thus, if this support level fails to hold Bitcoin will most likely fall back to the golden pocket zone. If this also fails to hold, Bitcoin finds its next support around $3000.
Bitcoin needs some serious increase in volume to break the very strong resistance between $4200-$4500. The current outlook is rather bearish, as the MACD also crossed bearishly.
ETH/USD DAILY CHART
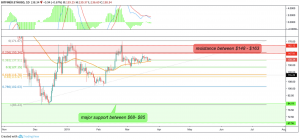
Ethereum’s price movements are very similar to Bitcoin’s currently. Ethereum was recently rejected by the $148 resistance, however, the 50-day-EMA held successfully as support so far. It seems likely that Ethereum will follow Bitcoin’s trend, as the MACD didn’t manage to cross bullishly. Thus, the current outlook is still rather bearish although Ethereum could see further sideways movement.
TOTAL MARKETCAP DAILY CHART
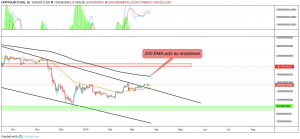 The total market capitalization of the cryptocurrency market broke out bullishly of the downward channel. The 50-day-EMA acted as support so far and the next resistance will be found at the 200-day-EMA.
TOTAL MARKETCAP WEEKLY CHART
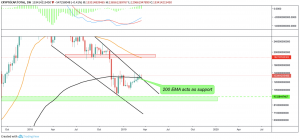
The weekly chart looks quite bullish, too. The 200-week-EMA was bullishly broken and acted as support so far. If the weekly candle closes above the 200-EMA, we can assume further upward movement. If the 200-week-EMA is bearishly broken, the next support will be found around $93b.
The top gainers of this week were:
RVN, which rose by 138 percent,
KCS, which surged by 60 percent,
and BIX, which rose by 73 percent.
There haven’t been relevant news this week.
- Check out our free forex signals
- Follow the top economic events on FX Leaders economic calendar
- Trade better, discover more Forex Trading Strategies
- Open a FREE Trading Account