Crude Oil Bouncing Off Support – Fibonacci Brings Profit
On the starting of the week, oil prices continued losses after a 3% fall last Friday due to increase tension between Mexico and the U.S...
At the start of the week, oil prices continued losses after a 3% fall last Friday due to increased tension between Mexico and the US. Secondly, the US President Trump declared to impose a tariff on all goods coming from Mexico, starting at 5% and going higher until the issue of illegal migration stops.
Consequently, WTI crude oil slipped dramatically to place a low around 52.25. So far, WTI has lost 16% while Brent oil is down 11%, recording the worst monthly losses in six months.
Leader of OPEC, Saudi Arabia, intimated that the group of oil producers together with Russia, would continue managing global crude supplies to avoid a surplus. As remarked by Saudi Energy Minister Khalid al-Falih, “We will do what is needed to sustain market stability beyond June. To me, that means drawing down inventories from their currently elevated levels.”
Let’s take a look at the technical side of the market.
Technical Analysis – Fibonacci & Doji Patterns
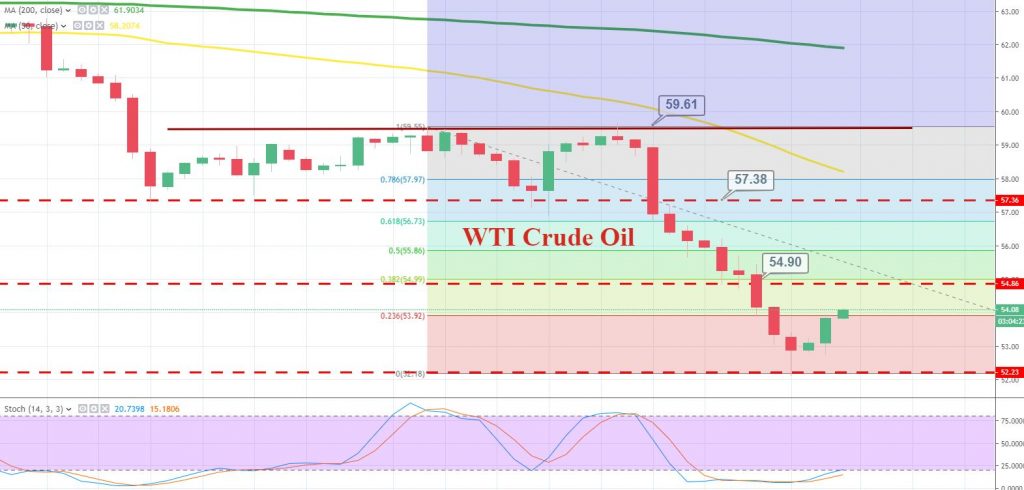
On the 4-hour chart, crude oil has closed a Doji pattern above 52.25. A hammer pattern is also along with it, and for your info, a hammer and doji followed by a sharp bearish trend typically drives bullish reversals in the market.
With that in mind, we drew a Fibonacci retracement indicator from 59.60 to 52.24 low. The indicator is suggesting a bullish target of 53.92 and 54.99, helping us secure first take profit at 53.90. For now, I would wait a bit before entering another buying position in crude oil.
- Check out our free forex signals
- Follow the top economic events on FX Leaders economic calendar
- Trade better, discover more Forex Trading Strategies
- Open a FREE Trading Account