WTI Crude Oil Prices Flashing Green as OPEC Hints at Deeper Cuts
Crude oil prices are stuck within a narrow range of 53.7 - 52.50. We may see choppy sessions if prices hold within this range; elsewhere...

WTI crude oil prices surged as OPEC indicates a deeper cut in stockpiles, and investors expect the potential Brexit deal between Britain and the Europan Union. However, gains were limited due to constant concerns of a global economic recession.
Meanwhile, news of a blast at Saudi Arabia’s Sasref refinery was cited as a tailwind for crude oil prices. The reason behind the explosion was a gas leak, but this renewed worries over supply disruptions after the September 14 attack on the kingdom’s massive Abqaiq oil processing facility that temporarily knocked out half of daily world crude production.
China now wants the United States to reduce tariffs before singing the purchase of $50 billion of American agriculture products under the phase one trade deal touted by US President Donald Trump.
China warned the United States over its interference in its internal matters and also gave a warning against the United States policy.
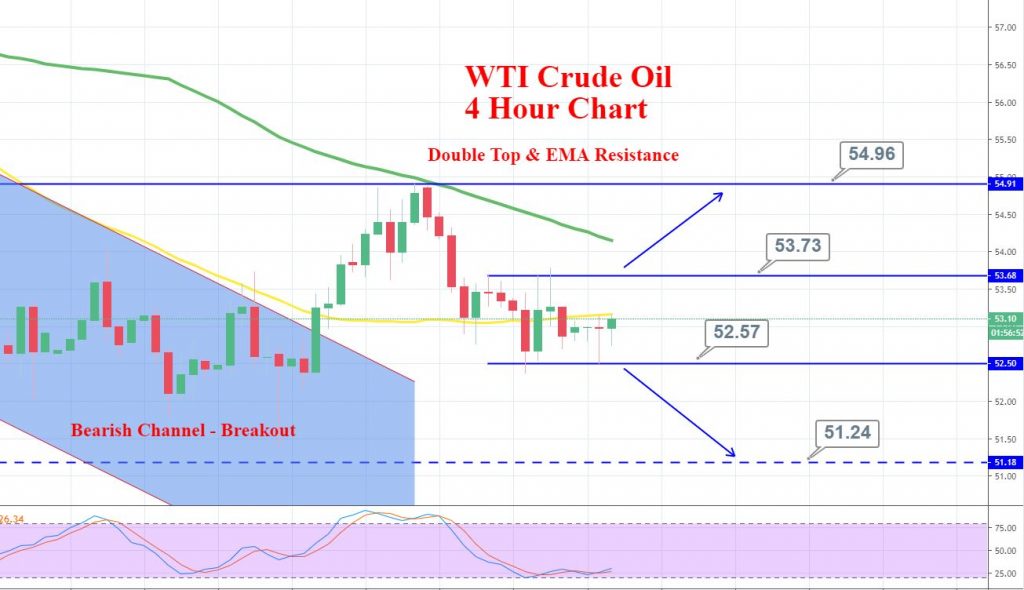
Daily Support and Resistance
S3 50.35
S2 51.73
S1 52.38
Pivot Point 53.11
R1 53.75
R2 54.48
R3 55.86
WTI Crude Oil – Forex Trading Signal
Fellas, the crude oil prices are stuck within a narrow range of 53.7 – 52.50. We may see choppy sessions if prices hold within this range; elsewhere, the violation of support 52.60 can extend bearish rally until 51.24.
Good luck!
- Check out our free forex signals
- Follow the top economic events on FX Leaders economic calendar
- Trade better, discover more Forex Trading Strategies
- Open a FREE Trading Account
- Read our latest reviews on: Avatrade, Exness, HFM and XM
Related Articles

Sidebar rates
Related Posts
